


Despite the economic impact of the 2020 pandemic, online advertising spending continued to increase in 2020 and 2021. The future growth figures look promising, too.
As spending grows, the online marketing ecosystem will be more competitive than ever in 2025.
We’ve curated the latest online advertising statistics in this blog to offer you a perspective and highlight the importance of digital ad spending.
Let’s dig deeper.
Online Advertising vs. Traditional Advertising Statistics
- 56% of overall marketing* funds are allocated to online channels. Businesses spent $436 billion* on digital advertising versus $196 billion on offline advertising;
- An average local business allocates 5-10% of its revenue* toward digital/online marketing. Larger businesses allocate about 14% of their business to online marketing;
- Total search advertising spending worldwide was estimated to be about $144.8 billion*;
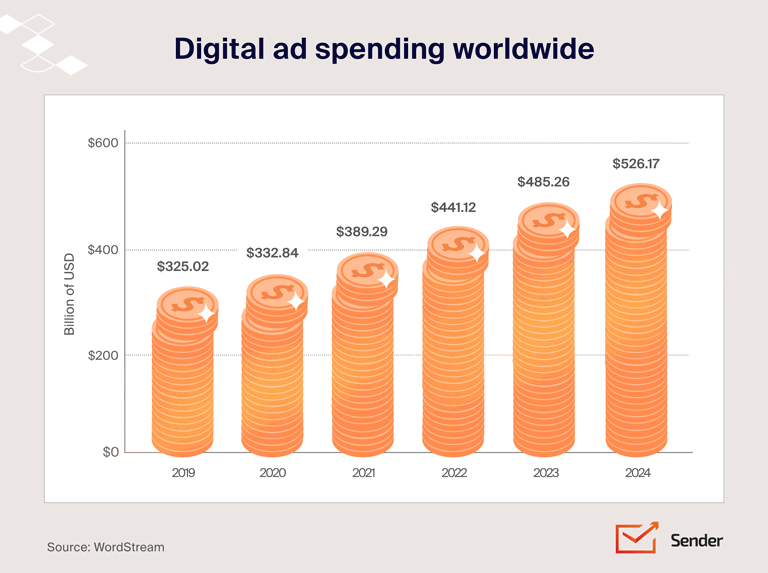
- Companies are expected to spend approx $485 billion* on digital advertising in 2023.
TV Advertising Statistics
- TV advertising has a 23% share of global ad spending;
- North America is the largest TV advertising region based on spending;
- TV advertising has grown by 17 billion between 2020 & 2021 and is expected to have a consistent spend of $131 billion between 2023 to 2028;
- Estimated spend on local TV advertising was $165.7 billion in 2023.
Digital Advertising Statistics
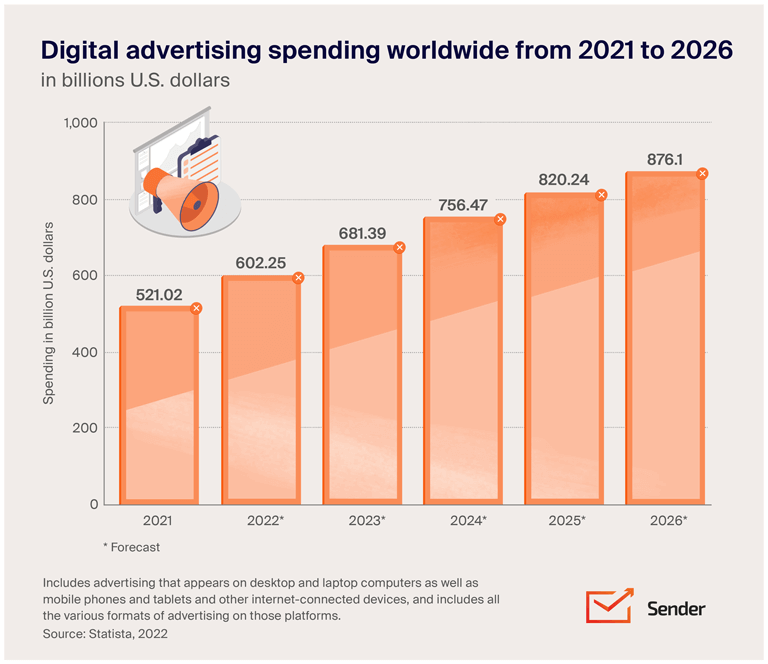
- The global digital ad spend will be $602.25 billion in 2023*, with search advertising being the biggest segment;
- The United States will register the highest digital advertising spending worldwide, with an estimated $232.70 billion spent in 2023;
- 69% of overall advertising spending will be generated via smartphones by 2026;
- Customers are 70% more likely* to buy from a retargeting ad;
- Facebook and Google Ads are the best-performing paid digital ad channels with the highest ROI;
- Digital ads can increase brand awareness by up to 80%.
Email Advertising Statistics
- 50%* of people buy from marketing emails at least once per month;
- 51%* of online shoppers in the US prefer emails vs other channels (notifications or SMS) to receive discounts;
- 62%* of marketers in the US have increased email marketing budgets in the last 12 months;
- Email marketing is ranked the second most effective channel* for lead generation after in-person tradeshows and events;
- 81%* of SME professionals trust email marketing improves their customer acquisition and retention efforts;
- Promotional or sales emails count for 72%* of all emails sent by marketers;
- 60%* of consumers say that marketing emails have influenced their buying decisions.
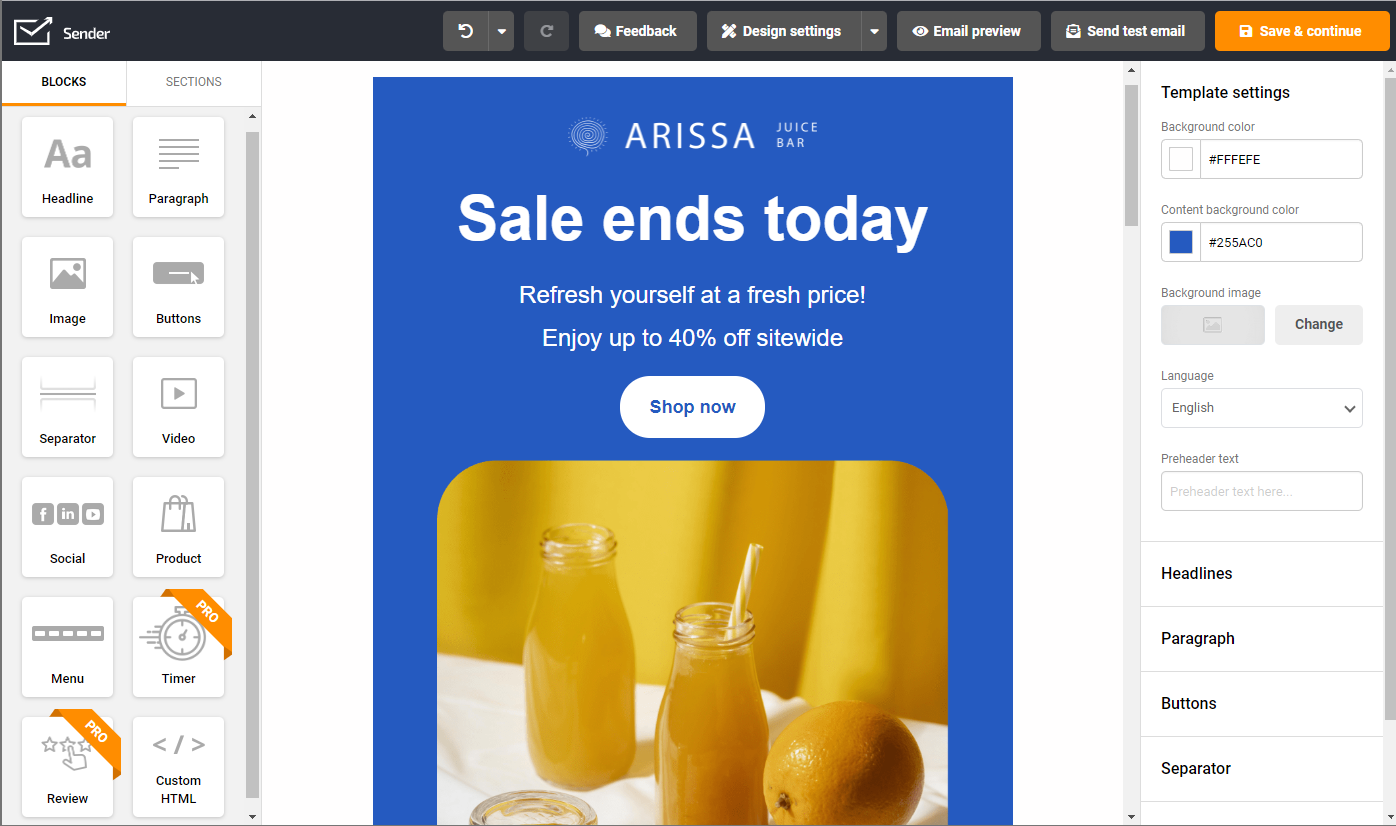
Interested in cost-effective yet incredibly powerful advertising? Email marketing is the answer!
PPC Advertising Statistics
- Companies will spend $190.5 billion* on paid search ads globally in 2024;
- Small to mid-sized businesses spend approximately $9000-10000 monthly on PPC campaigns*;
- On average, businesses earn $2 on every $1 spent* on PPC ads;
- 32%* of global companies use PPC to sell their products directly to customers;
- PPC brings 2x website visitors when compared to organic SEO.
Social Media Advertising Statistics
- Social media advertising spending accounts for 33% of all digital ad spending* in 2023;
- The social media market size is estimated to be worth $231.1 billion in 2023* and is expected to grow to 434.87 billion by 2027;
- 91%* of businesses use social media platforms for marketing or advertising their business;
- 91% of consumers use social media from mobile.
- Snapchat users are more likely (60%*) to make an impulse purchase and buy from their mobile devices;
- 95%* of Pinterest users use the app to plan or make a purchase. 52%* out of those discover a product on Pinterest and buy the product online later.
Instagram Advertising Statistics
- Instagram ads account for 9.8%* of all digital ad spend in the US in 2024;
- Ads on Instagram stories make 26.7%* of Instagram’s ad revenue;
- There has been a 12.2%* Y-o-Y increase in ad reach on Instagram;
- CTR for feed ads on Instagram ranges between 0.22% and 0.88%*;
- Average CPC on Instagram ads is between $0.00 & $0.25* in 2024;
Facebook Advertising Stats
- 86%* of businesses use Facebook for advertising;
- Less than 5% of businesses use Facebook video marketing ads currently;
- Facebook ads register an average conversion rate of 8.25%*;
- Facebook generates the highest ROI (29%) from advertising along with Instagram.
LinkedIn Advertising Statistics
- US consumers mark LinkedIn as the most trusted platform when it comes to advertising;
- 70%* of marketers see LinkedIn as a reliable advertising platform for getting a good ROI;
- Ads with a brand and acquisition message on LinkedIn are 6x more likely to convert.
Tiktok Advertising Stats
- TikTok is the fastest-growing social media platform, with 40%* of business owners planning to include Tiktok in their social media strategy;
- 25% of TikTok users research or buy the product after seeing a TikTok ad or organic post about it.
- 51%* of small business owners investing in TikTok advertising report a positive return on investment.
- Among SMBs that advertise on both TikTok and at least one Meta platform, 96% of small business owners report receiving the highest engagement on TikTok.
Mobile Advertising Statistics
- Mobile advertising spending will cross $339 million by 2023*;
- 78% of mobile searches* result in an in-store retail conversion;
- 52% of all PPC ad clicks are registered from mobile internet users;
- Mobile generates 94% of Facebook’s digital ad revenue.
Video Advertising Statistics
- Video advertising increases conversion rates by up to 86%*;
- Consumers report an increase of 136% in terms of brand association after watching a video;
- 90% of consumers agree that videos help them make a buying decision;
- 40% of shoppers globally purchase the product they discover on YouTube;
- Video ads account for more than half of Twitter’s digital advertising revenue*.
YouTube Advertising Statistics
- 80% of shoppers watch a YouTube video when they start the shopping process;
- 9%* of consumers find YouTube ads more relevant than TV advertisements;
- Vertical videos lead to higher conversions (up to 20%*) per dollar than other formats;
- 29%* of marketers feel pre-roll skippable ads are the most effective ones on YouTube;
- YouTube Shorts is the #1 platform for finding new products and brands*.
Display Advertising Statistics
- Customers are 155% more likely to search for a brand after seeing a display ad;
- Advertisers spend more than $50 million* on programmatic digital display advertising;
- Target audience and ad placement optimization are the most important optimization tactics used by display advertisers;
- Display ads increase the likelihood of conversion. Consumers who search after seeing a display ad are 59% more likely to convert*.
Influencer Advertising Statistics
- 92% of consumers trust recommendations from other people over brands;
- 81% of marketers feel that influencer advertising works for them;
- Word-of-mouth advertising improves customer retention by 37%* over other methods of advertising;
- 82% of marketers* plan to have a dedicated marketing budget for influencer marketing;
- Gen Z’s are most likely to be influenced by influencer advertising.
Online Advertising Costs
The cost of running an online campaign can vary greatly based on the platform of choice, your goals, and your audience. You can start from as little as a few hundred dollars a week and go on to spend thousands of dollars.
According to a survey in the United States, here’s a breakdown of the cost of advertising, including the cost of digital marketing and advertising:
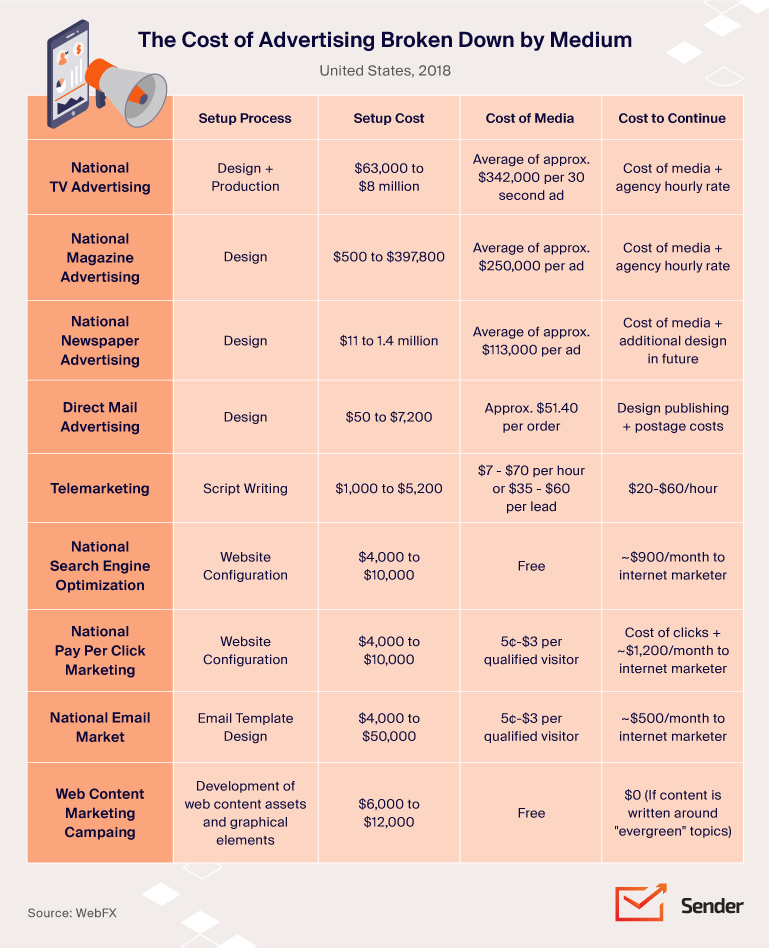
You might have to do some research based on the platforms and your own marketing goals before you come to a ballpark figure to start an online marketing campaign.
If you love numbers, you’ll love these articles:
- 55+ Personalization Statistics & Facts for 2024
- 40+ Latest Inbound Marketing Statistics (2024 Report)
- 70+ Lead Generation Statistics & Trends to Drive More Profits
*Sources:
- https://www.gartner.com/en/marketing/topics/marketing-budget
- https://www.marketingcharts.com/advertising-trends/spending-and-spenders-224702
- https://localiq.com/blog/marketing-budget/
- https://www.webfx.com/ppc/statistics/
- https://www.insiderintelligence.com/content/global-digital-ad-spending-update-q2-2020
- https://www.demandsage.com/digital-marketing-statistics/
- https://techjury.net/blog/ppc-stats/
- https://www.statista.com/statistics/276671/global-internet-advertising-expenditure-by-type/
- https://www.webfx.com/blog/marketing/marketing-stats/#ppc
- https://www.smallbizgenius.net/by-the-numbers/ppc-stats/#gref
- https://www.statista.com/statistics/303817/mobile-internet-advertising-revenue-worldwide/
- https://www.webfx.com/blog/marketing/video-marketing-statistics/
- https://www.hubspot.com/state-of-marketing
- https://martech.org/twitter-attributes-more-than-half-of-its-575m-q1-ad-revenue-to-video/
- https://localiq.com/blog/search-ads-vs-display-ads/
- https://www.ion.co/11-essential-stats-for-influencer-marketing-in-2016
- https://influencermarketinghub.com/influencer-marketing-statistics/
- https://hootsuite.widen.net/s/gqprmtzq6g/digital-2022-global-overview-report
- https://www.thebusinessresearchcompany.com/report/social-media-global-market-report
- https://www.statista.com/statistics/203513/usage-trands-of-social-media-platforms-in-marketing/
- https://localiq.com/blog/social-media-statistics/
- https://browsermedia.agency/blog/state-of-social-media-2022/
- https://nuoptima.com/top-snapchat-statistics
- https://thesocialshepherd.com/blog/pinterest-statistics
- https://www.socialmediatoday.com/social-business/pinterest-releases-new-stats-how-pinners-use-platform-make-purchases
- https://www.emarketer.com/insights/facebook-advertising-statistics/
- https://www.oberlo.com/statistics/instagram-ad-revenue
- https://datareportal.com/essential-instagram-stats
- https://www.brafton.com/blog/social-media/social-advertising-benchmarks/
- https://www.webfx.com/social-media/pricing/how-much-does-social-media-advertising-cost/
- https://www.hootsuite.com/research/social-trends
- https://business.linkedin.com/content/dam/me/business/en-us/marketing-solutions/cx/2020/pdfs/read-me-advertise-better-fa.pdf
- https://sproutsocial.com/insights/facebook-stats-for-marketers/#advertising
- https://blog.google/products/ads-commerce/vertical-video-youtube/ https://www.adweek.com/convergent-tv/marketers-think-the-6-second-pre-roll-spot-is-the-best-digital-video-ad-format/
- https://vidico.com/news/youtube-marketing-statistics/
- https://blog.hubspot.com/marketing/email-marketing-stats#b2c
- https://www.sender.net/blog/email-marketing-statistics/
- https://www.statista.com/statistics/245440/distributuion-of-global-advertising-expenditure-by-media/
- https://www.statista.com/statistics/268666/tv-advertising-spending-worldwide-by-region/
- https://www.tvscientific.com/insight/local-tv-advertising
- https://www.statista.com/statistics/237803/global-tv-advertising-revenue/
- https://www.capterra.com/resources/tiktok-marketing/


