Valentine’s Day has a rich and fascinating history, from its humble beginnings in the Middle Ages to the modern-day Saint Valentine frenzy of heart-shaped chocolates and candy-making machines.
But it’s not all that. Today, V Day is also filled with heartwarming traditions that bring family members and loved ones closer together.
As we approach this time of year, when sentiments fill the air and romantic love flows freely, it’s the perfect occasion to explore the enchanting world of Valentine’s Day statistics.
If you’re in 52% of consumers planning to celebrate Valentine’s Day, grab your favorite chocolate box, pen a sweet note to your dear Juliet or lovely Romeo, and let’s embark on a journey through the statistics that make Valentine’s Day unique. (You might also find some fun Valentine’s Day facts along the way, too!)
Valentine’s Marketing Statistics
Let’s start with some numbers no marketer could pass by – Valentine’s marketing statistics. We’ll look closer at the two most popular channels – email and social media.
But first, let’s see what types of loyalty program rewards are the most important to customers this Valentine’s Day. This is how it looks ranked based on what customers had to say:
- Product discounts – 55%;
- Special expedited shipping – 34%;
- Better return policies – 30%;
- Free samples with purchase – 26%;
- Complimentary gift wrapping – 20%.
Also read: Valentine’s Day Marketing: 15 Advertising Ideas
Valentine’s Day Email Marketing Stats
Our colleagues did a nice job by researching Valentine’s Day email campaigns sent between January 15 and February 14. It showed that the flower businesses were the most active in sending email campaigns, followed by chocolatiers:
- Flowers: 38.3 emails on average
- Chocolate: 21.3 emails on average
- Mass merchants: 21 emails on average
- Jewelry: 7.4 emails on average
Open rates of these email campaigns also show a story – hinting at the most famous Valentine’s Day gifts:
- Flowers: 17.2%
- Chocolate: 11%
- Mass merchants: 15.2%
- Jewelry: 9%
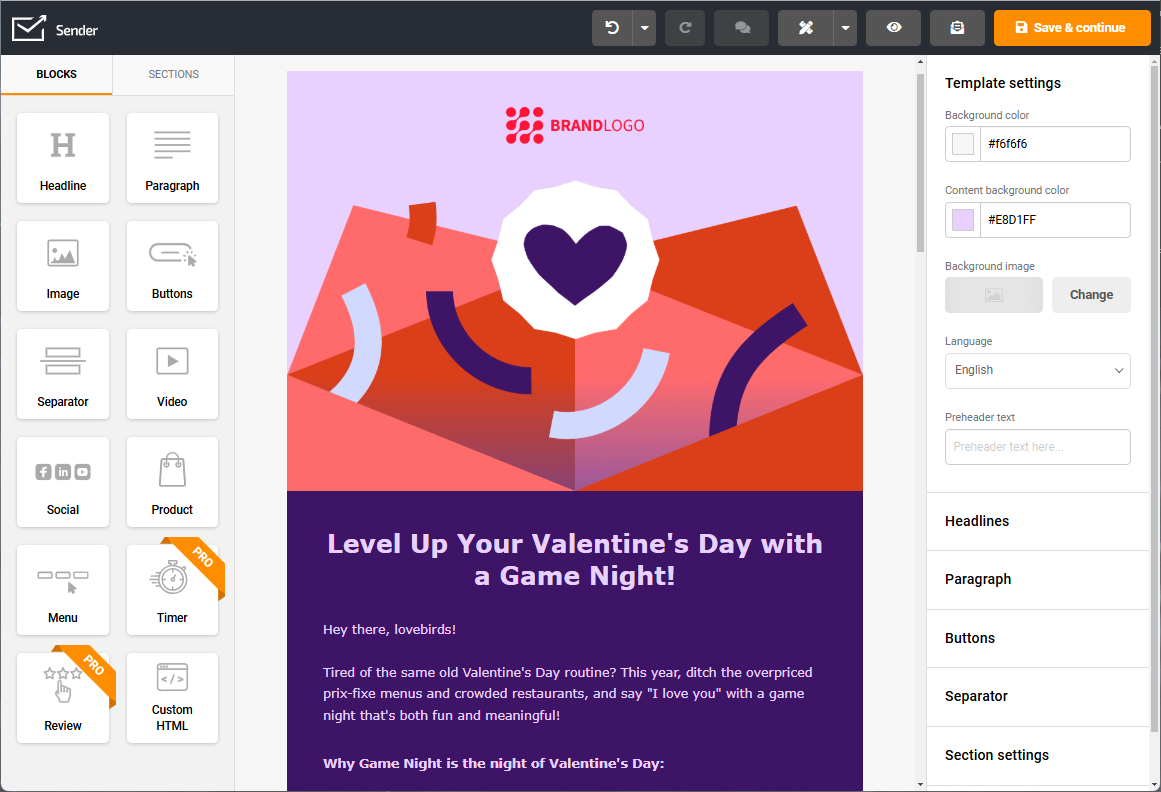
Want to team up with businesses rocking Valentine’s Day sales through email marketing? Make it happen with Sender’s easy drag-and-drop email builder – creating awesome newsletters has never been simpler!

Also read: Latest Email Marketing Statistics and ROI Figures
Valentine’s Social Media Engagement
Here are some fun Valentine’s Day facts and statistics you might find useful for your Valentine’s social media campaigns:
- Analysis of social media data using “Valentine’s Day” as a keyword shows the most associated term was “shop,” with “shop” and “gift” identified 131.17% more frequently than the term “love.”
- 60% of Generation Z and 56% of millennial social media users would do some of their holiday shopping via Instagram, TikTok, Facebook, and similar channels.
Valentine’s Day Spending Statistics
As noble as the idea behind Valentine’s Day is, the fact is that people are still going to spend money. Better questions are – what and how much will they spend it on? Let’s have a look.
Spending per Capita
This year, Americans are expected to spend an estimated $26 billion celebrating Valentine’s Day, more than $190 per person. Their loved ones are going to be lucky!
Spending on Flowers
According to the Society of American Florists, Valentine’s Day accounts for 30% of all holiday flower purchases, beating out Christmas, Mother’s Day, and Thanksgiving. In fact, approximately 250 million roses are grown each year just for Valentine’s Day.
Spending on Candy
Valentine’s Day is the dream time for sweet tooths as surprising $2.2 billion is spent on candy. Not a single candy-making machine is probably resting!
Spending on Cards
A whopping 145 million Valentine’s Day cards are exchanged every February 14. Just imagine the number of Valentines!
Spending on Jewelry
Candy and flowers might be some of the most common gifts for Valentine’s Day, but the category that we typically spend the most on for February 14 is jewelry, at a whopping $5.5 billion in 2023!
Valentine’s Day Demographics
Before we look closer at demographic statistics related to Valentine’s Day, let’s begin with a heartwarming fact – nearly 6 million couples get engaged on Valentine’s Day. Now, let’s explore some interesting differences in men’s and women’s behavior around this romantic day:
- 67.68% of men said they would purchase Valentine’s gifts for their loved ones;
- Men are likelier to spend more on gifts, with an average spending of $249;
- Women, on the other hand, have an estimated spending of $57;
- 60% of flowers purchased by women on Valentine’s Day are going to themselves.
Valentine’s Day Gift Shopping Statistics
Just like in previous years, the preferred choice for buying Valentine’s Day gifts remains online shopping, with 35% of people opting for this option. Department stores are a close second at 34%, followed by discount stores at 31% and specialty stores at 18%.
Popular Valentine’s Day Gifts
After Statista’s interviews with American customers, the survey revealed their Valentine’s Day shopping plans:
- 44% of shoppers say they will purchase candy;
- 33% are going to choose greeting cards, 32% flowers, and 29% an evening out;
- 14% select wine and 13% gift cards.
The survey also revealed not-so-popular choices for the occasion:
- 8% of Americans buy clothing items and perfume.
- 7% go for lingerie or pajamas;
- 5% choose a romantic holiday, and 4% choose beauty products;
- As little as 1% go for a pet.
Wrap Up
In wrapping things up, let’s take a friendly peek into the world of Valentine’s Day statistics for 2024. These numbers show us that Valentine’s Day is not just a romantic holiday but a fascinating blend of tradition and modern trends.
It’s a time when love shines, and we also see how marketing, social media, and our gift choices have evolved. So, as we navigate this changing landscape, let’s remember that Valentine’s Day is all about celebrating love, making connections, and enjoying the sweet moments that bring us closer together.
Also read:

