


Email marketing returns about $36 for every $1 spent. In 2025, the median open rate was 43.46% (inflated by Apple Mail Privacy Protection), the average click-through rate 2.09%, and the average conversion rate 0.08%. Roughly 392.5 billion emails are sent daily in 2026 to 4.73 billion users worldwide.
- An estimated 392.5 billion emails are sent and received worldwide every day in 2026, up from 376.4 billion in 2025.*
- The number of global email users is estimated at 4.73 billion in 2026 and is expected to exceed 4.85 billion by 2027.*
- Email marketing delivers an average return of around $36 for every $1 spent.*
- The median email open rate across industries was 43.46% in 2025.*
- In 2025, automated emails accounted for only 2% of sends but generated 30% of email-driven revenue, earning about 16× more revenue per send than scheduled campaigns.*
- The average email marketing campaign conversion rate is 0.08%*
This article is part of our Email marketing guide.
Email Marketing Benchmarks by Metric (2026)
Email marketing benchmarks give you a practical way to understand whether your campaigns are performing above, below, or in line with the wider market. The latest 2025 data shows how marketers are performing across core metrics such as opens, clicks, conversions, unsubscribes, bounce rates, and inbox placement, while also highlighting how dramatically results can vary between industries.
| Metric | Average / benchmark | Typical range by industry | Source | Data year |
| Open rate (MPP-inflated) | 43.46% | 30.10–55.71% | MailerLite | 2025 |
| Click-through rate (CTR) | 2.09% | 0.83–4.90% | MailerLite | 2025 |
| Click-to-open rate (CTOR) | 6.81% | 2.96–14.82% | MailerLite | 2025 |
| Conversion rate | 0.08% | 0.03–0.19% | Omnisend | 2025 |
| Bounce rate | <0.5–2%* | 0.01–0.22% | Mailgun | 2025 |
| Unsubscribe rate | 0.22% | 0.09–0.40% | MailerLite | 2025 |
| Spam complaint rate | 0.07% | <0.10% recommended | Validity | 2025 |
| Deliverability / inbox placement | 87.2% | 80.1–97.2% | Validity | 2025 |
Compared with 2024, several engagement benchmarks improved in 2025. MailerLite reports that the median open rate rose from 42.35% to 43.46%, click-through rate increased slightly from 2.00% to 2.09%, and click-to-open rate climbed from 5.63% to 6.81%. However, unsubscribe rates also increased from 0.08% to 0.22%, suggesting that stronger engagement does not necessarily mean every subscriber is becoming more receptive to email.
Deliverability also improved substantially. Validity recorded an average global inbox placement rate of 87.2% in 2025, up from 83.5% in 2024. At the same time, marketers should be cautious when comparing open rates with historical data because Apple Mail Privacy Protection automatically records some messages as opened. That makes clicks, conversions, and inbox placement increasingly valuable indicators of actual campaign performance alongside traditional open-rate benchmarks.
Open Rate Statistics (with MPP Caveat)
When evaluating an email campaign, open rate is often the first engagement metric marketers look at. However, it now comes with an important caveat: Apple Mail Privacy Protection (MPP) can preload tracking pixels and register an email as opened even when the recipient has not actually viewed it. This can inflate reported open rates, so they are best assessed alongside click-through rates, conversions, and other engagement metrics.
Here are the latest open rate benchmarks to compare your campaigns against:
- The median email open rate reached 43.46% in 2025, up from 42.35% in 2024.*
- Emails that use a custom preheader tend to perform better than those that rely on default preview text.*
- Automated emails achieve significantly stronger engagement after the open, with an average 4.66% click-through rate and 11.87% click-to-open rate.*
- 41% of email opens are mobile opens.*
Open Rates by Industry
| Industry | Open Rate | Click Rate | Bounce Rate |
| Education | 45.32% | 2.26% | 1.35% |
| Ecommerce | 31.08% | 1.19% | 0.57% |
| Restaurant | 43.69% | 1.13% | 0.37% |
| Beauty and personal care | 39.81% | 1.46% | 0.26% |
Click-through & Click-to-Open Statistics
The click-through rate (CTR) tells how many people clicked any of the links within your email. If you’re serious about link clicks, here are some statistics:
- Computer software and financial services marketing has the lowest average click-through rate (CTR) at 0.25% to 0.45%.*
- Law enforcement has the highest average email click-through rate at 8.65%.*
- Average cold email response rates generally hover between 1% and 5%.*
- Average email click-through rate across industries range from 0.83 to 4.9%.*
Click-through Rate by Email Type
| Type of Email | Click-through Rate |
| Triggered emails | 10.75% |
| Autoresponder emails | 6.56% |
| Newsletters | 3.48% |
| RSS emails | 7.24% |
Conversion, Bounce, Unsubscribe & Spam Complaint Rates
Marketing professionals like us are mostly interested in conversions for evaluating a channel’s success. Let’s see what the data has to say about email conversion rates:
- Abandoned cart emails convert 3x more than other automated emails.*
- A healthy email bounce rate is typically below 2%*
- The average email bounce rate across industries is 1.01%*
- Ecommerce emails average a bounce rate of around 0.57%.*
- The average email marketing campaign conversion rate is 0.08%.*
- The average global spam complaint rate is around 0.07%.*
- Email providers often flag senders when spam complaint rates exceed 0.1–0.3%.*
- The average unsubscribe rate in 2025 was 0.22%, almost three times higher than 0.08% in 2024.*
Email Subject Line Statistics
If you’re curious about how you should design your next marketing campaign, here are some trends and numbers, including email subject line statistics, to guide your decisions.
- Using personalization in an email may lead to a 41% increase in click-throughs.*
- Shorter subject lines (under 70 characters) have the highest open rates.*
- 6-word subject lines are optimal, but 2-4 word subject lines still perform best.*
- Around 60% of marketers saw open rate improvements when using emojis in their subject lines.*
Deliverability Statistics
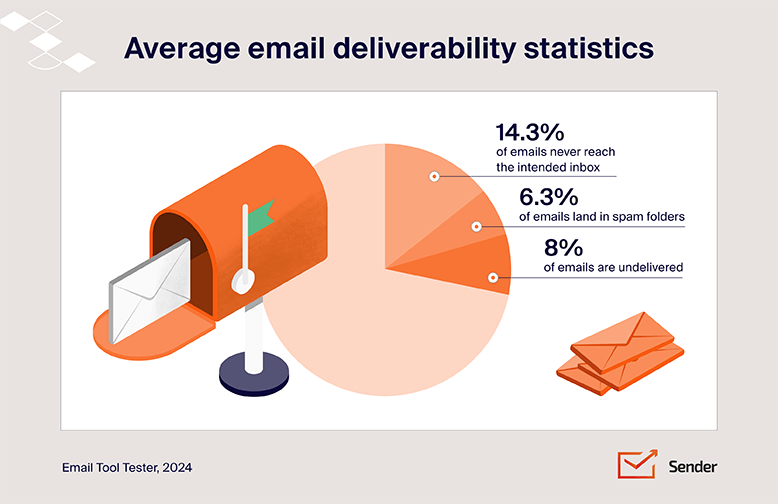
Nearly 1 in 6 marketing emails never made it to the inbox in 2026, emphasizing the need for strategic email practices to enhance deliverability. Here’s some useful email deliverability statistics to rethink about email deliverability rates:
- In 2026, the average email deliverability, or inbox placement rate was 83-87%.*
- 43% of email senders said their ability to reach the inbox improved over the previous 12 months, while 42% said it remained about the same.*
- 40% of senders identified staying out of spam as one of their biggest email deliverability challenges.*
- Other major deliverability challenges include maintaining list hygiene (27%), measuring deliverability (25%), reducing bounces (25%), and improving sender reputation (24%).*
- 56% of senders use dedicated deliverability monitoring tools, while 40% rely on analytics from their email service provider.*
- 61% of senders had implemented DMARC in 2025, up from 54% in 2024 and around 43% in 2023, highlighting the growing importance of authentication protocols such as SPF, DKIM, and DMARC.*
Email Marketing ROI Statistics
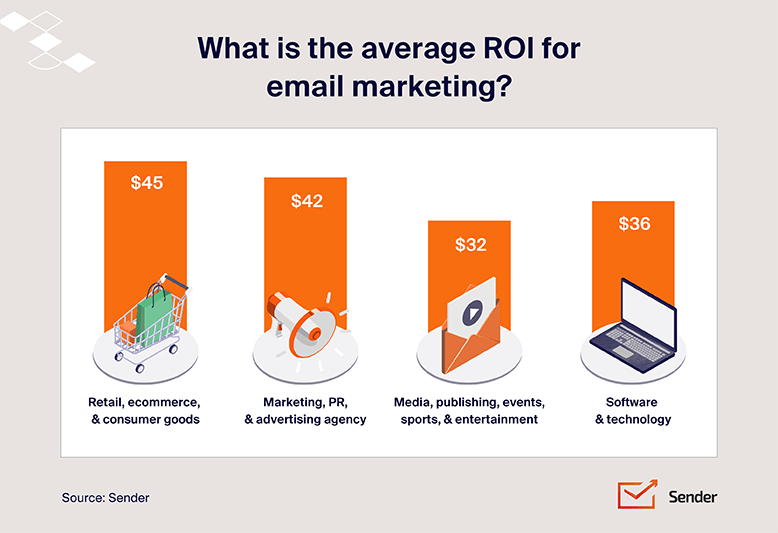
The first email campaign, sent in 1978, generated $13 million in sales, and email has remained one of the highest-ROI marketing channels ever since. Today, email marketing can deliver returns of around $36 for every $1 spent on average – although actual ROI varies by industry, audience, campaign type, and how effectively email is used.
Here are some numbers about email marketing ROI:
- 35% of companies earn between $10 and $36 for every $1 spent on email marketing.*
- 30% earn between $36 and $50 for every $1 spent.*
- 5% earn more than $50 for every $1 spent.*
- 21% of marketing leaders do not measure email ROI, down from 36% in 2023.*
- As a platform-specific example, marketers using Omnisend averaged $79 in revenue for every $1 spent in 2025.*
Global Email Usage & Market Size
If you want to understand how widely email is used around the world, the latest statistics provide valuable insight into global adoption and usage trends. The figures below highlight how many people currently use email, how usage continues to grow, and how it compares across different regions and demographics.
- The number of email users worldwide is set to cross 4.85 billion in 2027 – an increase of 100+ million users since 2026;
- Email client market share is dominated by Apple Mail at 58% market share, followed by Gmail (29%). Combined, Apple and Google control nearly 90% of the whole email market.
- Nearly 10 billion emails are sent daily in the US (2025), making it the leading country. Germany and Ireland follow, each with roughly 8.5 billion emails per day;
- Generation Z leads all age groups in sending emails via smartphones, with about 67% using their phones for email;
- Around 376.4 billion emails were sent and received each day worldwide in 2025, an increase from 361.6 billion in 2024;
- Nearly 195 billion spam emails are sent per day, making up about half of total email traffic.
- The global email marketing market was valued at approximately USD 13.72 billion in 2026;
- Market forecasts indicate that the global email marketing industry could reach a value of USD 36.3 billion by 2033.
Email vs. Other Channels
Email isn’t the only channel competing for marketers’ attention. SMS, social media, and direct mail all play important roles in reaching customers and driving action. The latest 2025 data shows how these channels compare on engagement, influence, and response, giving useful context for evaluating where email fits in the broader marketing mix.
- 30% of consumers want to receive promotional offers from brands via text messaging.*
- The average SMS marketing campaign achieves a 5.76% click rate.*
- There were 5.24 billion active social media user identities worldwide in 2025, up 4.1% year over year.*
- 76% of social media users say social content influenced at least some of their purchases in the previous six months, rising to 90% among Gen Z.*
- 84% of consumers read direct mail immediately or on the same day it arrives, up from 70% in 2024.*
- 81% of consumers take some form of action after receiving direct mail, up from 60% in 2024.*
Segmentation, Personalization & AI Statistics
Segmentation, personalization, and AI are all changing how brands approach email. Instead of sending the same message to everyone, marketers can use customer data for dynamic content, combined with automation, to make emails more relevant. The latest statistics show how much these tactics can influence engagement, spending, and overall campaign performance.
Email Segmentation Statistics
Segmentation plays a crucial role in deciding the success of email marketing campaigns. Subscriber segmentation that drives lift like this is built into most modern ESPs. Here’s some research data:
- Segmented emails can achieve 85.53% higher open rates and 54.43% higher click-through rates than non-segmented emails.*
- 71% of consumers abandon experiences they consider irrelevant.*
- About 51% of marketing professionals consider list segmentation one of their top marketing techniques.*
Personalization & AI statistics
Now, here are some recent statistics portraying the increased usage of personalization, AI personalization and other AI tools in marketing:
- Use of generative AI in email marketing grew 340% between 2024 and 2025.*
- Marketers using AI were 46% more likely to exceed their marketing goals than those not using AI.*
- 75% of companies say personalization increases customer spending.*
- 91% of marketing leaders say employees/teams at their organization use AI to assist them in their job.*
Automation & Email-Type Statistics
Marketers that want better results leverage automation. We’re not saying that – that’s the numbers speaking. Check the latest marketing automation email statistics in the next section.
Email Automation Statistics
If you ask marketers, they’ll say that email automation is the best thing since sliced bread. An automation-first email service provider helps you send the right message to the right audience at the right time, every time.
Let’s look at some automated email workflow statistics to support the theory:
- Automated emails represented only 2% of email sends but generated 30% of email-driven revenue in 2025.*
- Each automated email generated about 16× more revenue per send than a scheduled campaign.*
- Automated emails achieved roughly 30% higher open rates, 332% higher click rates, and 2,361% higher conversion rates than regular scheduled emails in 2025.*
- Back-in-stock automations reached a 59.19% open rate and 5.34% conversion rate.*
Types of Emails Marketers Send
Email marketing is effective in reaching diverse audiences, engaging them, and achieving significant ROI. Here’s some analytical data to illustrate it:
- Customer engagement emails are the most widely used type, sent by 63% of marketers.*
- Promotional emails are used by 58% of marketers.*
- Newsletters are also used by 58% of marketers, up from 46% in 2024.*
- Event-related emails are used by 55% of marketers.*
- Re-engagement emails are used by 49% of marketers.*
- Onboarding emails are used by 44% of marketers.*
Brands are also known to utilize customer winbacks, blogs, re-engagement, and cart abandonment emails throughout the buyer’s lifecycle.
Welcome Email Statistics
- Welcome emails averaged a 35.53% open rate in 2025.*
- Welcome emails generated an average 3.94% click-through rate and 11.19% click-to-open rate.*
- The average welcome email conversion rate was 2.11%.*
- Welcome emails generated an average of $6.16 in revenue per email sent.*
- Welcome email average unsubscribe rate was 0.87%.*
- Welcome emails, together with abandoned cart and browse-abandonment emails, generated 87% of all automated orders in 2025.*
- Top-performing welcome emails can reach 15% click rates and nearly 10% placed-order rates.*
Send Time & Frequency Statistics
When it comes to email marketing, timing matters almost as much as content. The day you schedule your campaign can have a noticeable impact on engagement and performance.
Below are several data points on the best days and send frequency to marketing emails.
Best Day and Time to Send Marketing Emails
- Weekday emails still drive the most action, with Tuesday and Friday generating the highest average click rates, while weekend open rates remain surprisingly close to weekday performance.*
- The best send day varies by audience: ecommerce emails get the most opens on Friday and the most clicks on Tuesday, while creators peak for clicks on Monday and institutions on Friday.*
- Friday at 6 PM delivers the highest average open rate of the week at 49.7% and also the highest average click rate at 8.09%.*
Email Frequency Statistics
How many emails you send also has an impact on your email marketing success, just like what you include in your emails. Here are some numbers:
- 32% of consumers prefer to receive retail marketing emails once a week, while another 20% prefer emails two to three times per week.*
- Sending emails twice per week generated the highest average click rate at 5.31%, compared with 4.87% for weekly emails and 4.97% for daily emails.*
- 36.3% of businesses send one to three emails per month, while 29.5% send emails weekly. Overall, 52% send at least one email per week.*
- 10.8% of businesses send emails daily, while 11.1% send fewer than one email campaign per month.*
- Emails sent one to three times per month averaged a 33.48% open rate, compared with 33.22% for weekly sends, 32.98% for twice-weekly sends, and 30.04% for daily emails.*
B2B, B2C & Ecommerce Statistics
Whether you’re in the B2B or B2C industry, email marketing can work wonders for both. We’ve curated the latest email marketing statistics for the B2B & B2C industries:
B2B Email Marketing Statistics
For the B2B industry, email marketing is the primary method to distribute content and nurture leads.
Here’s the latest B2B email marketing data:
- 71% of B2B marketers use email newsletters to distribute content, while 63% use email more broadly as a distribution channel.*
- 42% of B2B marketers say email is one of the distribution channels that produces the best results, while 37% say the same for email newsletters.*
- 65% of B2B companies use customer engagement emails, making them the most common B2B email type in Litmus’ 2025 State of Email data.*
- For B2B marketers, customer engagement emails generate the highest email ROI compared with other email types.*
- 73% of B2B buyers actively avoid suppliers that send irrelevant outreach, based on a 2024 buyer survey published by Gartner in 2025.*
B2C Email Marketing Statistics
Email is one of the most rewarding channels for B2C businesses if you look at open rates, click rates, and conversion rates. Here are the latest B2C email marketing insights:
- 81% of consumers are more likely to open emails tailored to their interests.*
- 84% of loyal customers are more likely to buy again after receiving an email reminder or deal.*
- 47% of B2C marketers are prioritizing AI in 2025.*
- Only 47% of companies use basic email accessibility practices such as alt text.*
Ecommerce Email Marketing Statistics
If you use ecommerce email marketing, these statistics are not just interesting, but directly relevant to your business:
- 60% of consumers prefer email for brand communication.*
- 41% say relevance to a previous purchase is a key reason they open marketing emails.*
- An average email ROI in the ecommerce industry is 4400%.*
Email Marketing Trends for 2026
Email marketing in 2026 is changing less because email itself is new and more because the way teams build, measure, and improve campaigns is shifting. AI is speeding up production, interactive content is becoming standard, and privacy and accessibility are getting harder to ignore. These statistics show how email marketing trends are shaping up currently:
- 78% of email teams can build and deploy an email in three days or less.*
- 70% of marketers expect up to half of email operations to be AI-driven by the end of 2026.*
- 97% of marketers used at least one interactive element in emails in 2025.*
- 58% of consumers worry about transparency around how brands collect their data.*
Numbers tell you what’s normal or simply put – what seems to be working. But knowing what’s normal isn’t the same as knowing what to do. For the strategic side of the picture, the full email marketing playbook walks through how to act on these benchmarks.
*Sources:
https://www.emailtooltester.com/en/blog/email-marketing-statistics/ https://www.emailtooltester.com/en/blog/email-deliverability-statistics/ https://www.emailtooltester.com/en/blog/spam-statistics/ https://www.constantcontact.com/blog/email-marketing-research-and-statistics/ https://www.getresponse.com/resources/reports/email-marketing-benchmarks https://www.statista.com/statistics/812060/email-marketing-revenue-worldwide/ https://www.hubspot.com/state-of-marketing https://blog.hubspot.com/marketing/hubspot-blog-marketing-industry-trends-report https://truelist.co/blog/mobile-email-statistics/
https://backlinko.com/email-marketing-stats
https://www.litmus.com/email-client-market-share/ https://www.litmus.com/blog/infographic-the-roi-of-email-marketing/ https://www.emarketer.com/insights/email-marketing-personalization-trends/ https://www.klaviyo.com/marketing-resources/email-benchmarks-by-industry https://snov.io/blog/email-frequency-best-practices/
https://www.validity.com/wp-content/uploads/2024/02/The-State-of-Email-in-2024-Keeping-Ahead-of-the-Curve.pdf
https://www.omnisend.com/2025-ecommerce-marketing-report/ https://www.getresponse.com/blog/email-marketing-statistics https://www.zerobounce.net/email-statistics-report/ https://blog.hubspot.com/marketing/state-of-ai-report https://blog.hubspot.com/marketing/email-marketing-stats https://designmodo.com/email-marketing-roi-statistics/ https://www.mailerlite.com/blog/compare-your-email-performance-metrics-industry-benchmarks
https://www.twilio.com/en-us/blog/ideal-email-subject-length https://www.twilio.com/en-us/blog/insights/the-best-time-to-send-your-email-campaign
https://www.mailerlite.com/blog/best-time-to-send-email https://www.statista.com/statistics/456500/daily-number-of-e-mails-worldwide/ https://www.statista.com/statistics/255080/number-of-e-mail-users-worldwide/ https://humanic.ai/blog/32-ai-for-email-marketing-statistics-2024-2025-data-every-marketer-needs
https://blog.hubspot.com/marketing/state-of-generative-ai https://www.emailtooltester.com/en/blog/how-many-emails-are-sent-per-day/ https://www.emailtooltester.com/en/blog/email-usage-statistics/ https://www.omnisend.com/resources/reports/2026-ecommerce-marketing-report https://www.mailerlite.com/blog/improve-email-open-rate https://www.omnisend.com/blog/email-marketing-benchmarks/ https://www.mordorintelligence.com/industry-reports/email-marketing-market https://www.activecampaign.com/blog/email-ctr/
https://www.salesgenie.com/wp-content/uploads/2025/05/The-2024-State-of-Email-Trends-3.pdf
https://lebesgue.io/email-marketing/should-you-use-emojis-in-email-subject-lines https://www.litmus.com/blog/why-your-best-marketing-channel-is-driving-customers-away
https://www.mailerlite.com/blog/email-cadence-and-frequency-best-practices https://itbrief.co.uk/story/nearly-18-of-business-emails-fail-to-reach-inboxes
https://www.mailgun.com/email-impact-report/chapter/deliverability-impact/ https://www.omnisend.com/blog/email-marketing-roi https://www.klaviyo.com/blog/welcome-email-examples https://sinch.com/blog/omnichannel-customer-journey/ https://www.klaviyo.com/blog/whatsapp-vs-sms-vs-email https://sproutsocial.com/insights/press/new-research-from-sprout-social-finds-social-media-is-the-top-place-gen-z-turns-to-for-search-surpassing-traditional-search-engines/
https://www.lob.com/state-of-direct-mail/consumer-insights/2025-report https://mailmend.io/blogs/spam-complaint-statistics?department=customer+success https://martech.org/ai-is-making-a-major-impact-of-email-marketing-teams-report-finds/
https://www.twilio.com/en-us/press/releases/socer-2025 https://www.klaviyo.com/solutions/ai/ai-in-marketing
https://snov.io/blog/email-marketing-statistics/
https://www.litmus.com/blog/trends-in-email-marketing https://contentmarketinginstitute.com/b2b-research/b2b-content-marketing-trends-research-2025
https://www.litmus.com/blog/b2b-email-marketing https://www.gartner.com/en/newsroom/press-releases/2025-06-25-gartner-sales-survey-finds-61-percent-of-b2b-buyers-prefer-a-rep-free-buying-experience https://gauss.hr/en/blog/ecommerce-email-marketing-statistics https://www.globenewswire.com/news-release/2026/03/05/3250556/0/en/Email-Is-the-Channel-Consumers-Love-Most-and-Hate-Most-Optimove-Research-Reveals.html
https://www.emarketer.com/content/retailers-should-rethink-email-strategies-ai-tools-loom
https://www.optimove.com/resources/reports/2025-optimove-insights-consumer-marketing-fatigue-full-report