

The advertising landscape has never moved faster. With global advertising market size statistics pointing to a $1.17 trillion industry in 2025, understanding where money is being spent — and what’s actually working — is essential for any marketer or business owner.
This article compiles 70+ of the most important advertising statistics across every major channel and format, from TV and email to programmatic and influencer marketing, so you can make smarter, data-backed decisions about your strategy.
Top Advertising Statistics at a Glance
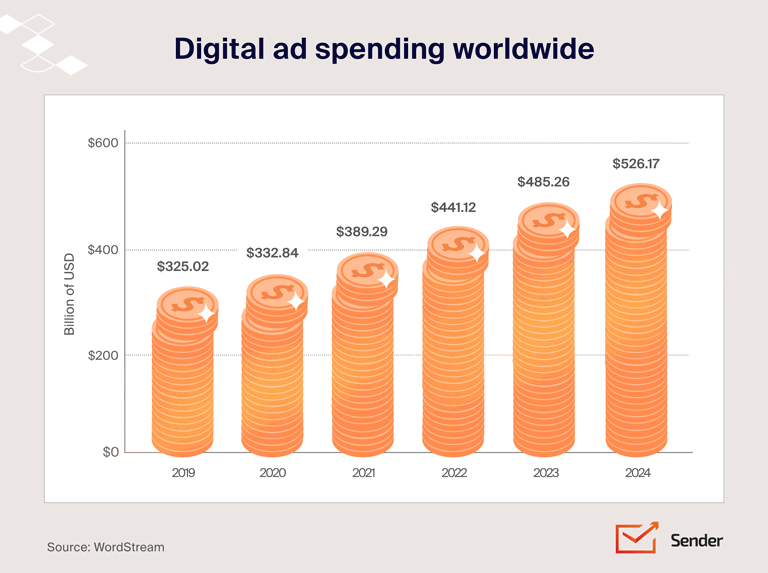
- Global advertising spending reached $1.17 trillion in 2025, with $798.7 billion (73%) allocated to digital advertising.
- Programmatic advertising is expected to represent 81.4% of total digital ad spend in 2026, up from virtually nothing a decade ago.
- Digital video captured nearly 60% of all U.S. TV/video ad spend in 2025, up from just 29% in 2020.
- LinkedIn delivered a 121% ROAS in 2025, making it the only major platform to generate a positive return on ad spend.
- TikTok advertising reached 1.59 billion users globally by January 2025, representing 19.4% of the global population.
- 86% of consumers make a purchase inspired by an influencer at least once per year.
- Mobile advertising reached $447 billion in 2025, fueled by 5.78 billion unique mobile users worldwide.
- On average, businesses earn $2 for every $1 spent on PPC ads.
Online Advertising vs. Traditional Advertising Statistics
The shift from traditional to digital channels has been one of the most significant transformations in marketing history. Advertising growth statistics consistently show digital pulling further ahead each year, with digital now accounting for nearly three-quarters of all global ad spend.
The numbers below illustrate just how dramatically the balance of power has shifted:
- Global advertising spending is projected to reach $1.17 trillion in 2025, with $798.7 billion (73%) allocated to digital advertising;
- An average local business allocates 5-10% of its revenue toward digital/online marketing. Larger businesses allocate about 14% of their business to online marketing;
- Total search advertising spending worldwide was estimated to be about $334.4 billion;
- The United States leads digital ad spending with $325 billion yearly.
TV Advertising Statistics
Television is no longer a purely traditional medium — it’s rapidly being redefined by digital video. Streaming, connected TV, and on-demand content have changed how audiences consume ads, and advertisers are following them there.
Here’s how TV ad spending is evolving heading into 2026:
- Digital video captured nearly 60% of all U.S. TV/video ad spend in 2025, up from 29% in 2020.
- Digital video ad spend rose 18% in 2024 to $64 billion and to $72 billion in 2025.
- Global television advertising spend is forecast to grow by 2.4% in 2026.
Digital Advertising Statistics
Digital advertising now dominates marketing budgets worldwide. The following figures break down the biggest trends shaping digital advertising today:
- The global digital ad spend was $798.7 billion in 2025, with search advertising being the biggest segment;
- The United States will register the highest digital advertising spending worldwide, with an estimated $325 billion spent in 2025;
- The average Google Ads conversion rate in 2025 is 7.52% across all industries;
- Digital video ad spend rose 18% in 2024 to $64 billion and to $72 billion in 2025;
- 43% of marketers rank Facebook as one of the highest ROI-driving social media platforms.
Email Advertising Statistics
Despite being one of the oldest digital marketing channels, email marketing continues to punch well above its weight. Advertising effectiveness statistics consistently highlight email as one of the highest-performing channels for both reach and return, especially in influencing purchase decisions.
Here’s what the data says about email’s place in the modern marketing mix:
- 51%* of online shoppers in the US prefer emails vs other channels (notifications or SMS) to receive discounts;
- Email marketing is ranked the second most effective channel* for lead generation after in-person tradeshows and events;
- Promotional or sales emails count for 72%* of all emails sent by marketers;
- 60%* of consumers say that marketing emails have influenced their buying decisions;
- About 75% of marketers plan to maintain or increase their email marketing investment in 2026.
Interested in cost-effective yet incredibly powerful advertising? Email marketing is the answer!
PPC Advertising Statistics
Pay-per-click advertising remains one of the most measurable and scalable ways to drive traffic and sales. The numbers below cover global PPC spend, returns, and how businesses are using paid search today:
- Companies spent $334.4 billion on paid search ads globally in 2025;
- On average, businesses earn $2 on every $1 spent on PPC ads;
- 32% of global companies use PPC to sell their products directly to customers;
- Social media advertising spending accounts for 33% of all digital ad spending;
- The social media market size is estimated at $276.7 billion in 2025 and is expected to grow to $ 434.87 billion by 2027.
Instagram Advertising Statistics
Instagram has grown into one of the most powerful paid social channels available, particularly for brands targeting younger, visually-driven audiences.
Explore the key metrics that define Instagram’s advertising landscape below:
- Instagram ads reached 1.74 billion users in January 2025;
- Instagram’s reported ad reach grew by more than 5% year over year in early 2025;
- Instagram generated $32.03 billion in U.S. ad revenue in 2025, up 24.4% from 2024;
- Instagram is expected to account for 11.1% of all U.S. digital ad spending by 2026.
- Average Instagram ad benchmarks in 2026 are about $1.23 CPC, 0.9% CTR, and $6.70 CPM.
Facebook Advertising Stats
With nearly 9 in 10 businesses advertising on the platform, Facebook remains the cornerstone of social media marketing for most brands. Its unmatched scale and targeting capabilities continue to make it a top choice for advertisers at every budget level.
Here’s a look at the numbers behind Facebook’s advertising performance:
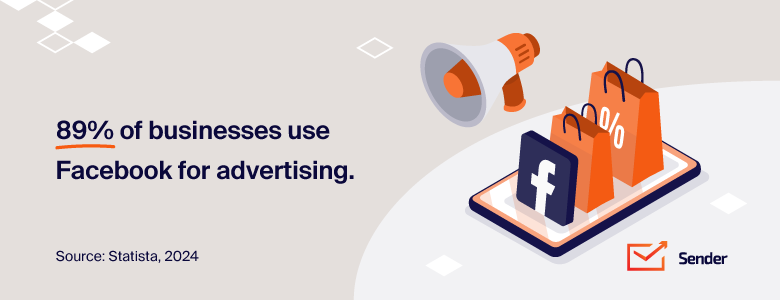
- 89% of businesses use Facebook for advertising;
- Less than 5% of businesses use Facebook video marketing ads currently;
- The average Facebook Ads conversion rate across all industries is 9.21% in 2025;
- 69.6% of marketers use Facebook in their marketing strategy in 2026;
- 43% of marketers rank Facebook among the highest ROI-driving social media platforms in 2026.
LinkedIn Advertising Statistics
LinkedIn occupies a unique and valuable niche in the paid social ecosystem, particularly for B2B marketers.
The stats below highlight why LinkedIn deserves serious consideration in any B2B media plan:
- LinkedIn delivered a 121% ROAS in 2025, making it the only platform in the reported comparison to generate positive return on ad spend;
- LinkedIn captured 41% of B2B paid social budgets in 2025, the largest share among platforms assessed;
- 93% of LinkedIn marketers say video ads directly improve ROI.
TikTok Advertising Stats
TikTok has gone from cultural phenomenon to advertising powerhouse in just a few years. Advertising engagement statistics on the platform consistently outperform those of older social networks, fueled by its highly immersive, full-screen video format and algorithm-driven discovery.
Here’s where TikTok stands as an advertising platform heading into 2026:
- TikTok advertising reach expanded to 1.59 billion users globally by January 2025, representing 19.4% of the global population;
- TikTok is projected to generate more than $17 billion in U.S. ad revenue in 2026.
- 57% of marketers are already using TikTok in their strategy in 2026, and 32% say it consistently delivers the highest ROI.

Pinterest and Snapchat Advertising Stats
Pinterest and Snapchat may not command the same headlines as Meta or TikTok, but both platforms offer highly engaged, distinct audiences that can deliver strong results for the right brands.
From visual discovery shopping on Pinterest to ephemeral storytelling on Snapchat, here are the key advertising stats for both platforms:
- Pinterest generated $4.40 billion in revenue in 2025, up 14% year over year, while reaching record users;
- Pinterest reached 553 million global monthly active users in Q4 2024, up 11% year over year, and later hit 578 million in Q2 2025;
- Pinterest ads reached 4.1% of the world’s population in January 2025;
- Snapchat ads reached 709 million users in January 2025;
- Snap reported $1.716 billion in Q4 2025 revenue, up 10% year over year, and total active advertisers grew 28% year over year.
X (Twitter) Advertising Statistics
X has had a turbulent few years from an advertising perspective, but the numbers suggest a meaningful recovery is underway. Below are the latest figures on X’s ad revenue, user reach, and platform performance:
- X’s worldwide ad revenue is forecast to rise 16.5% year over year in 2025, reaching $2.26 billion.
- X’s U.S. ad revenue grew 17.5% in 2025 to $1.31 billion.
- X ads reached 7.1% of the world’s total population in January 2025.
- X ads reached 9.9% of adults aged 18+ worldwide in January 2025.
- X had 104 million ad-reachable users in the United States in early 2025, equal to 30.0% of the total U.S. population.
Mobile Advertising Statistics
Mobile is no longer just a channel — it’s the primary screen for billions of people worldwide. Here’s how the mobile advertising market was shaping up in 2025 and beyond:
- Mobile advertising market was valued at $402 billion in 2024, and reached $447 billion in 2025;
- In-app video ads captured over 30% of total U.S. mobile advertising spend in 2024 for the first time, with spending reaching $61.11 billion;
- Global user-acquisition spend in mobile apps reached $78 billion in 2025, up 13% year over year;
- The number of unique mobile users worldwide reached 5.78 billion in October 2025, equal to 70.1% of the global population.
Video Advertising Statistics
Video has become the dominant format in digital advertising, and the gap between video and every other format is only widening. Advertising click-through rate statistics and completion rates consistently favor video, especially short-form and vertical formats built for mobile consumption.
The figures below capture the scale and momentum of video ad spending today:
- US digital video ad spending grew 18% year-over-year in 2024 to $64 billion and to $72 billion in 2025;
- Digital video captured nearly 60% of all U.S. TV/video ad spend in 2025, up from 29% in 2020;
- Digital video ad spend in the U.S. rose 18% in 2024 to $64 billion and to reach $72 billion in 2025;
- More than 33% of shoppers say they’ve purchased products they discovered on YouTube.
YouTube Advertising Statistics
YouTube remains the undisputed leader in online video advertising, reaching billions of users and serving as a go-to destination for product research and discovery. Its range of ad formats—from skippable pre-rolls to Short— gives advertisers flexible options to match their goals and budgets.
Here’s what the data says about advertising on YouTube:
- Vertical videos lead to higher conversions (up to 20%*) per dollar than other formats;
- 29%* of marketers feel pre-roll skippable ads are the most effective ones on YouTube;
- Adding a vertical video asset to Video action campaigns can deliver 10%–20% more conversions per dollar on YouTube Shorts compared with landscape videos alone;
- YouTube ranked as the No. 1 platform for product reviews and product information in a 2025 U.S.

Display Advertising Statistics
Display advertising may be one of the more established corners of digital marketing, but it continues to evolve through better targeting, richer formats, and programmatic automation. Advertising budget allocation statistics across the industry show display receiving significant investment, particularly as brands prioritize top-of-funnel awareness.
Here are the key display advertising benchmarks to know:
- Advertisers spend more than $50 million* on programmatic digital display advertising in 2025;
- Target audience and ad placement optimization are the most important optimization tactics used by display advertisers;
- Display ads increase the likelihood of conversion. Consumers who search after seeing a display ad are 59% more likely to convert*.
Programmatic Advertising Statistics
Programmatic advertising has quietly become the backbone of digital media buying, now accounting for nearly all new display ad dollars.
The data below covers growth, adoption, and where the channel is headed:
- Worldwide programmatic display ad spending grew 14.6% in 2025.
- Programmatic accounted for 96.8% of new display ad dollars in 2025.
- More than 4 in 5 programmatic display ad dollars will transact via programmatic direct and private marketplaces in 2025.
- Programmatic advertising is expected to represent 81.4% of total digital ad spend in 2026.
- Programmatic maturity is strongest in display, with 30% of respondents ranking it as the most mature digital channel in 2026.
Native Advertising Statistics
Native advertising blends seamlessly into the content surrounding it, making it one of the least disruptive—and most effective—formats available to digital advertisers. Its growing reliance on returning clients signals a maturing market where trust and performance drive long-term relationships.
Here’s a look at how native advertising is performing across the industry:
- U.S. native display ad spending is expected to grow 13.1% in 2026, reaching $147.98 billion;
- Native advertising revenue is becoming more retention-driven: 60% of native advertising revenue now comes from returning clients, according to the 2025 Native Advertising Institute report;
- In 2024, U.S. internet advertising revenue reached $258.6 billion, up 14.9% year over year;
- Native video ads get an average 50% completion rate and 60% average viewability.
Influencer Advertising Statistics
Influencer marketing has evolved from a niche tactic into a mainstream advertising channel with a serious budget behind it.
Here’s what the latest data reveals about the state of influencer advertising.
- 86% of U.S. marketers are expected to partner with influencers in 2025;
- 86% of consumers make a purchase inspired by an influencer at least once per year;
- 67% of consumers say the best brand–influencer collaborations are honest and unbiased;
- 71% of top-performing brands in CreatorIQ’s 2025–2026 study said creator marketing delivered more than 3x ROI.

Online Advertising Costs
The cost of running an online campaign can vary greatly based on the platform of choice, your goals, and your audience. You can start from as little as a few hundred dollars a week and go on to spend thousands of dollars. 54% of business leaders expect to spend $1,000–$10,000 per month on marketing in 2026.
According to recent U.S.-focused small-business marketing benchmarks, monthly costs typically break down like this:
- Search engine optimization (SEO): $2,500–$7,500 per month
- Paid advertising: $100–$10,000 per month
- Social media marketing: $100–$5,000 per month
- Email marketing and SMS: $50–$100 per month
- Content marketing: $5,000–$10,000 per month
- Web design: $501–$5,000 annually
You might have to do some research based on the platforms and your own marketing goals before you come to a ballpark figure to start an online marketing campaign.
If you love numbers, you’ll love these extra articles:
- 75+ Personalization Statistics You Need to Know in 2026
- 40+ Latest Inbound Marketing Statistics (2026 Report)
- 80+ Lead Generation Statistics to Know (2026)
Sources:
- https://www.gartner.com/en/marketing/topics/marketing-budgethttps://localiq.com/blog/marketing-budget/
- https://www.webfx.com/ppc/statistics/https://www.demandsage.com/digital-marketing-statistics/
- https://techjury.net/blog/ppc-stats/
- https://www.statista.com/statistics/276671/global-internet-advertising-expenditure-by-type/
- https://www.webfx.com/blog/marketing/marketing-stats/#ppc
- https://www.smallbizgenius.net/by-the-numbers/ppc-stats/#gref
- https://www.statista.com/statistics/303817/mobile-internet-advertising-revenue-worldwide/
- https://www.webfx.com/blog/marketing/video-marketing-statistics/
- https://martech.org/twitter-attributes-more-than-half-of-its-575m-q1-ad-revenue-to-video/
- https://localiq.com/blog/search-ads-vs-display-ads/
- https://influencermarketinghub.com/influencer-marketing-statistics/
- https://hootsuite.widen.net/s/gqprmtzq6g/digital-2022-global-overview-report
- https://www.thebusinessresearchcompany.com/report/social-media-global-market-report
- https://www.statista.com/statistics/203513/usage-trands-of-social-media-platforms-in-marketing/
- https://localiq.com/blog/social-media-statistics/
- https://browsermedia.agency/blog/state-of-social-media-2022/
- https://nuoptima.com/top-snapchat-statistics
- https://thesocialshepherd.com/blog/pinterest-statistics
- https://www.socialmediatoday.com/social-business/pinterest-releases-new-stats-how-pinners-use-platform-make-purchases
- https://datareportal.com/essential-instagram-stats
- https://www.emarketer.com/press-releases/instagram-will-make-up-more-than-half-of-metas-us-ad-revenues-in-2025
- https://metricool.com/social-media-ads
- https://www.oberlo.com/statistics/instagram-ad-revenue
- https://datareportal.com/essential-instagram-stats
- https://www.brafton.com/blog/social-media/social-advertising-benchmarks/
- https://www.webfx.com/social-media/pricing/how-much-does-social-media-advertising-cost/
- https://www.hootsuite.com/research/social-trends
- https://blog.google/products/ads-commerce/vertical-video-youtube/
- https://www.adweek.com/convergent-tv/marketers-think-the-6-second-pre-roll-spot-is-the-best-digital-video-ad-format/
- https://vidico.com/news/youtube-marketing-statistics/
- https://www.hubspot.com/marketing-statistics
- https://www.sender.net/blog/email-marketing-statistics/
- https://www.statista.com/statistics/245440/distributuion-of-global-advertising-expenditure-by-media/
- https://www.statista.com/statistics/268666/tv-advertising-spending-worldwide-by-region/
- https://www.tvscientific.com/insight/local-tv-advertising
- https://www.statista.com/statistics/237803/global-tv-advertising-revenue/
- https://www.statista.com/outlook/amo/advertising/worldwide
- https://www.blog.udonis.co/advertising/mobile-advertising-market
- https://www.emarketer.com/content/linkedin-achieves-121–roas-leads-b2b-marketing-paid-performance
- https://www.warc.com/content/paywall/article/warc-curated-datapoints/global-tiktok-ad-reach-at-159-billion-the-us-remains-its-largest-market/en-gb/159525
- https://www.iab.com/insights/video-ad-spend-report-2025/
- https://www.dentsu.com/news-releases/global-ad-spend-forecasts-2025
- https://cropink.com/advertising-statistics
- https://investor.pinterestinc.com/news-and-events/press-releases/default.aspx
- https://datareportal.com/essential-snapchat-stats
- https://www.emarketer.com/content/x-ad-revenue-forecast-2025
- https://www.reuters.com/technology/x-report-first-annual-ad-revenue-growth-since-musks-takeover-data-shows-2025-03-26/
- https://datareportal.com/essential-x-stats
- https://www.iab.com/insights/video-ad-spend-report-2025-part-one
- https://business.google.com/en-all/think/consumer-insights/digital-marketing-trends-2026/
- https://business.google.com/us/think/search-and-video/short-and-long-form-videos
- https://www.emarketer.com/content/worldwide-programmatic-ad-spending-2025
- https://iabeurope.eu/knowledge_hub/iab-europes-attitudes-to-digital-advertising-report-2026
- https://www.nativeadvertisinginstitute.com/blog/native-advertising-defies-industry-slowdown-double-digit-growth
- https://www.outbrain.com/blog/video-marketing-statistics
- https://sproutsocial.com/insights/influencer-marketing-statistics/
- https://www.creatoriq.com/hubfs/2025-26%20State%20of%20Creator%20Marketing/CreatorIQ-StateofCreatorMarketing2025-2026.pdf
- https://www.webfx.com/industries/general/small-businesses/marketing-budget/