
Black Friday, one of the most significant shopping events of the year, brings massive deals, impressive discounts, and sales events. Online retailers and in-store shopping, each with its unique strategies, play crucial roles in this annual retail bonanza.
To show you just how impactful this shopping weekend is, we’ve gathered a wide range of Black Friday retail statistics to prepare you for this year’s iteration. Get curious!
Black Friday Statistics at Glance
- US online Black Friday sales reached a record $11.8 billion in 2025;
- 186.9 million people were expected to shop across the Thanksgiving-to-Cyber-Monday weekend in 2025;
- Global online Black Friday sales hit $79 billion in 2025;
- Cyber Week 2025 generated $44.2 billion in online sales;
- Cyber Monday reached $14.25 billion in sales, beating Black Friday’s $11.8 billion;
- 70% of online orders during Cyber Week 2025 came from mobile devices;
- Shopify merchants generated $14.6 billion during Black Friday–Cyber Monday 2025, up 27% year over year;
- Average conversion rates during Black Friday reached 5.86%, compared to the annual ecommerce average of 2.8%.
Statistics That Prove the Importance of Black Friday
Black Friday has evolved into the unofficial kickoff of the holiday shopping season, significantly influencing consumer spending patterns. No longer just a single-day event, it has become a multi-day shopping holiday with retailers offering extended deals and promotions.
Black Friday’s impact as a shopping event is undeniable. In 2025, US online Black Friday revenue statistics showed a record $11.8 billion, while Black Friday shopping traffic statistics predicted 186.9 million people to shop across the Thanksgiving-to-Cyber-Monday weekend.
These figures highlight the continuing importance of Black Friday for both consumers and businesses.
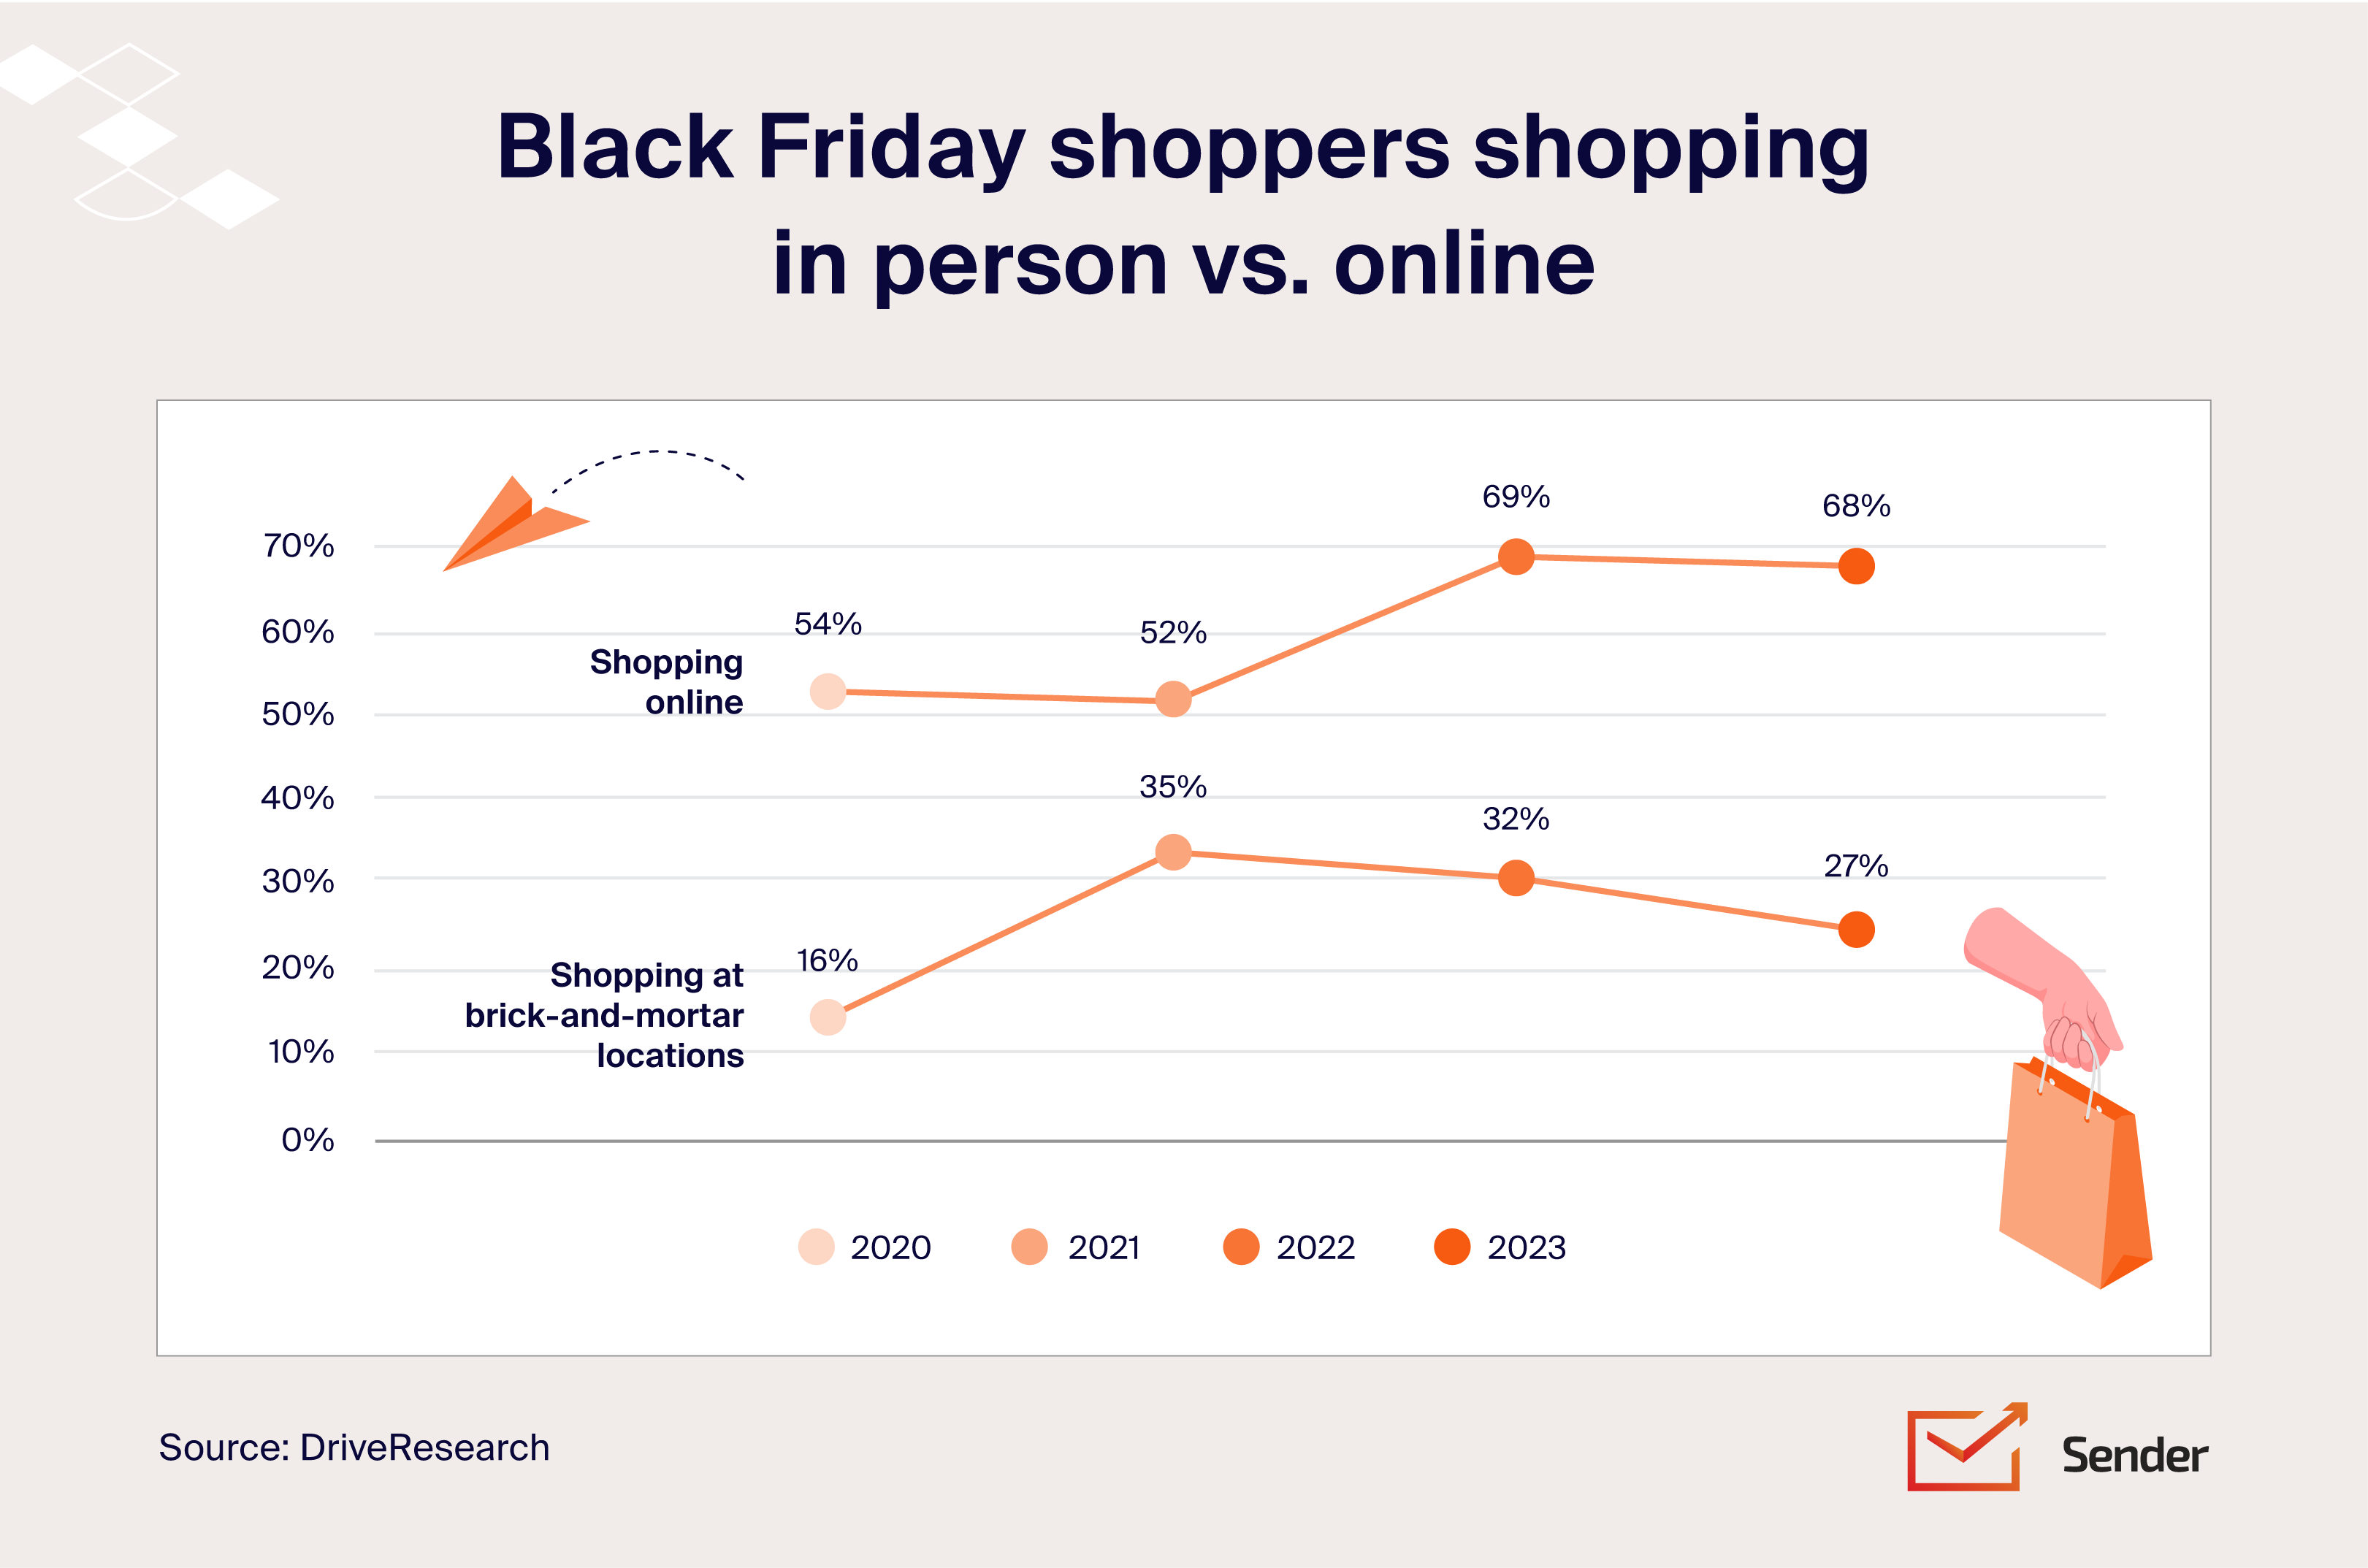
Online Sales vs. In-Store Sales Trends Over Time
Black Friday’s digital dominance continued in 2025, with global online sales surging by 6.18% year-over-year to reach a staggering $79 billion*. Mastercard also reported that US online Black Friday sales grew 10.4% year over year in 2025, compared with a more modest 1.7% increase in in-store sales.
The message is clear: consumers are increasingly motivated to buy online, drawn to the convenience and competitive online deals available.
Top Black Friday Statistics
The Black Friday shopping frenzy just keeps getting bigger and better each year, bringing along some truly eye-popping Black Friday stats that show how crucial it is in the retail world.
Whether you prefer to shop online or shop in-store, the data reveals trends that everyone in the retail industry can take advantage of.
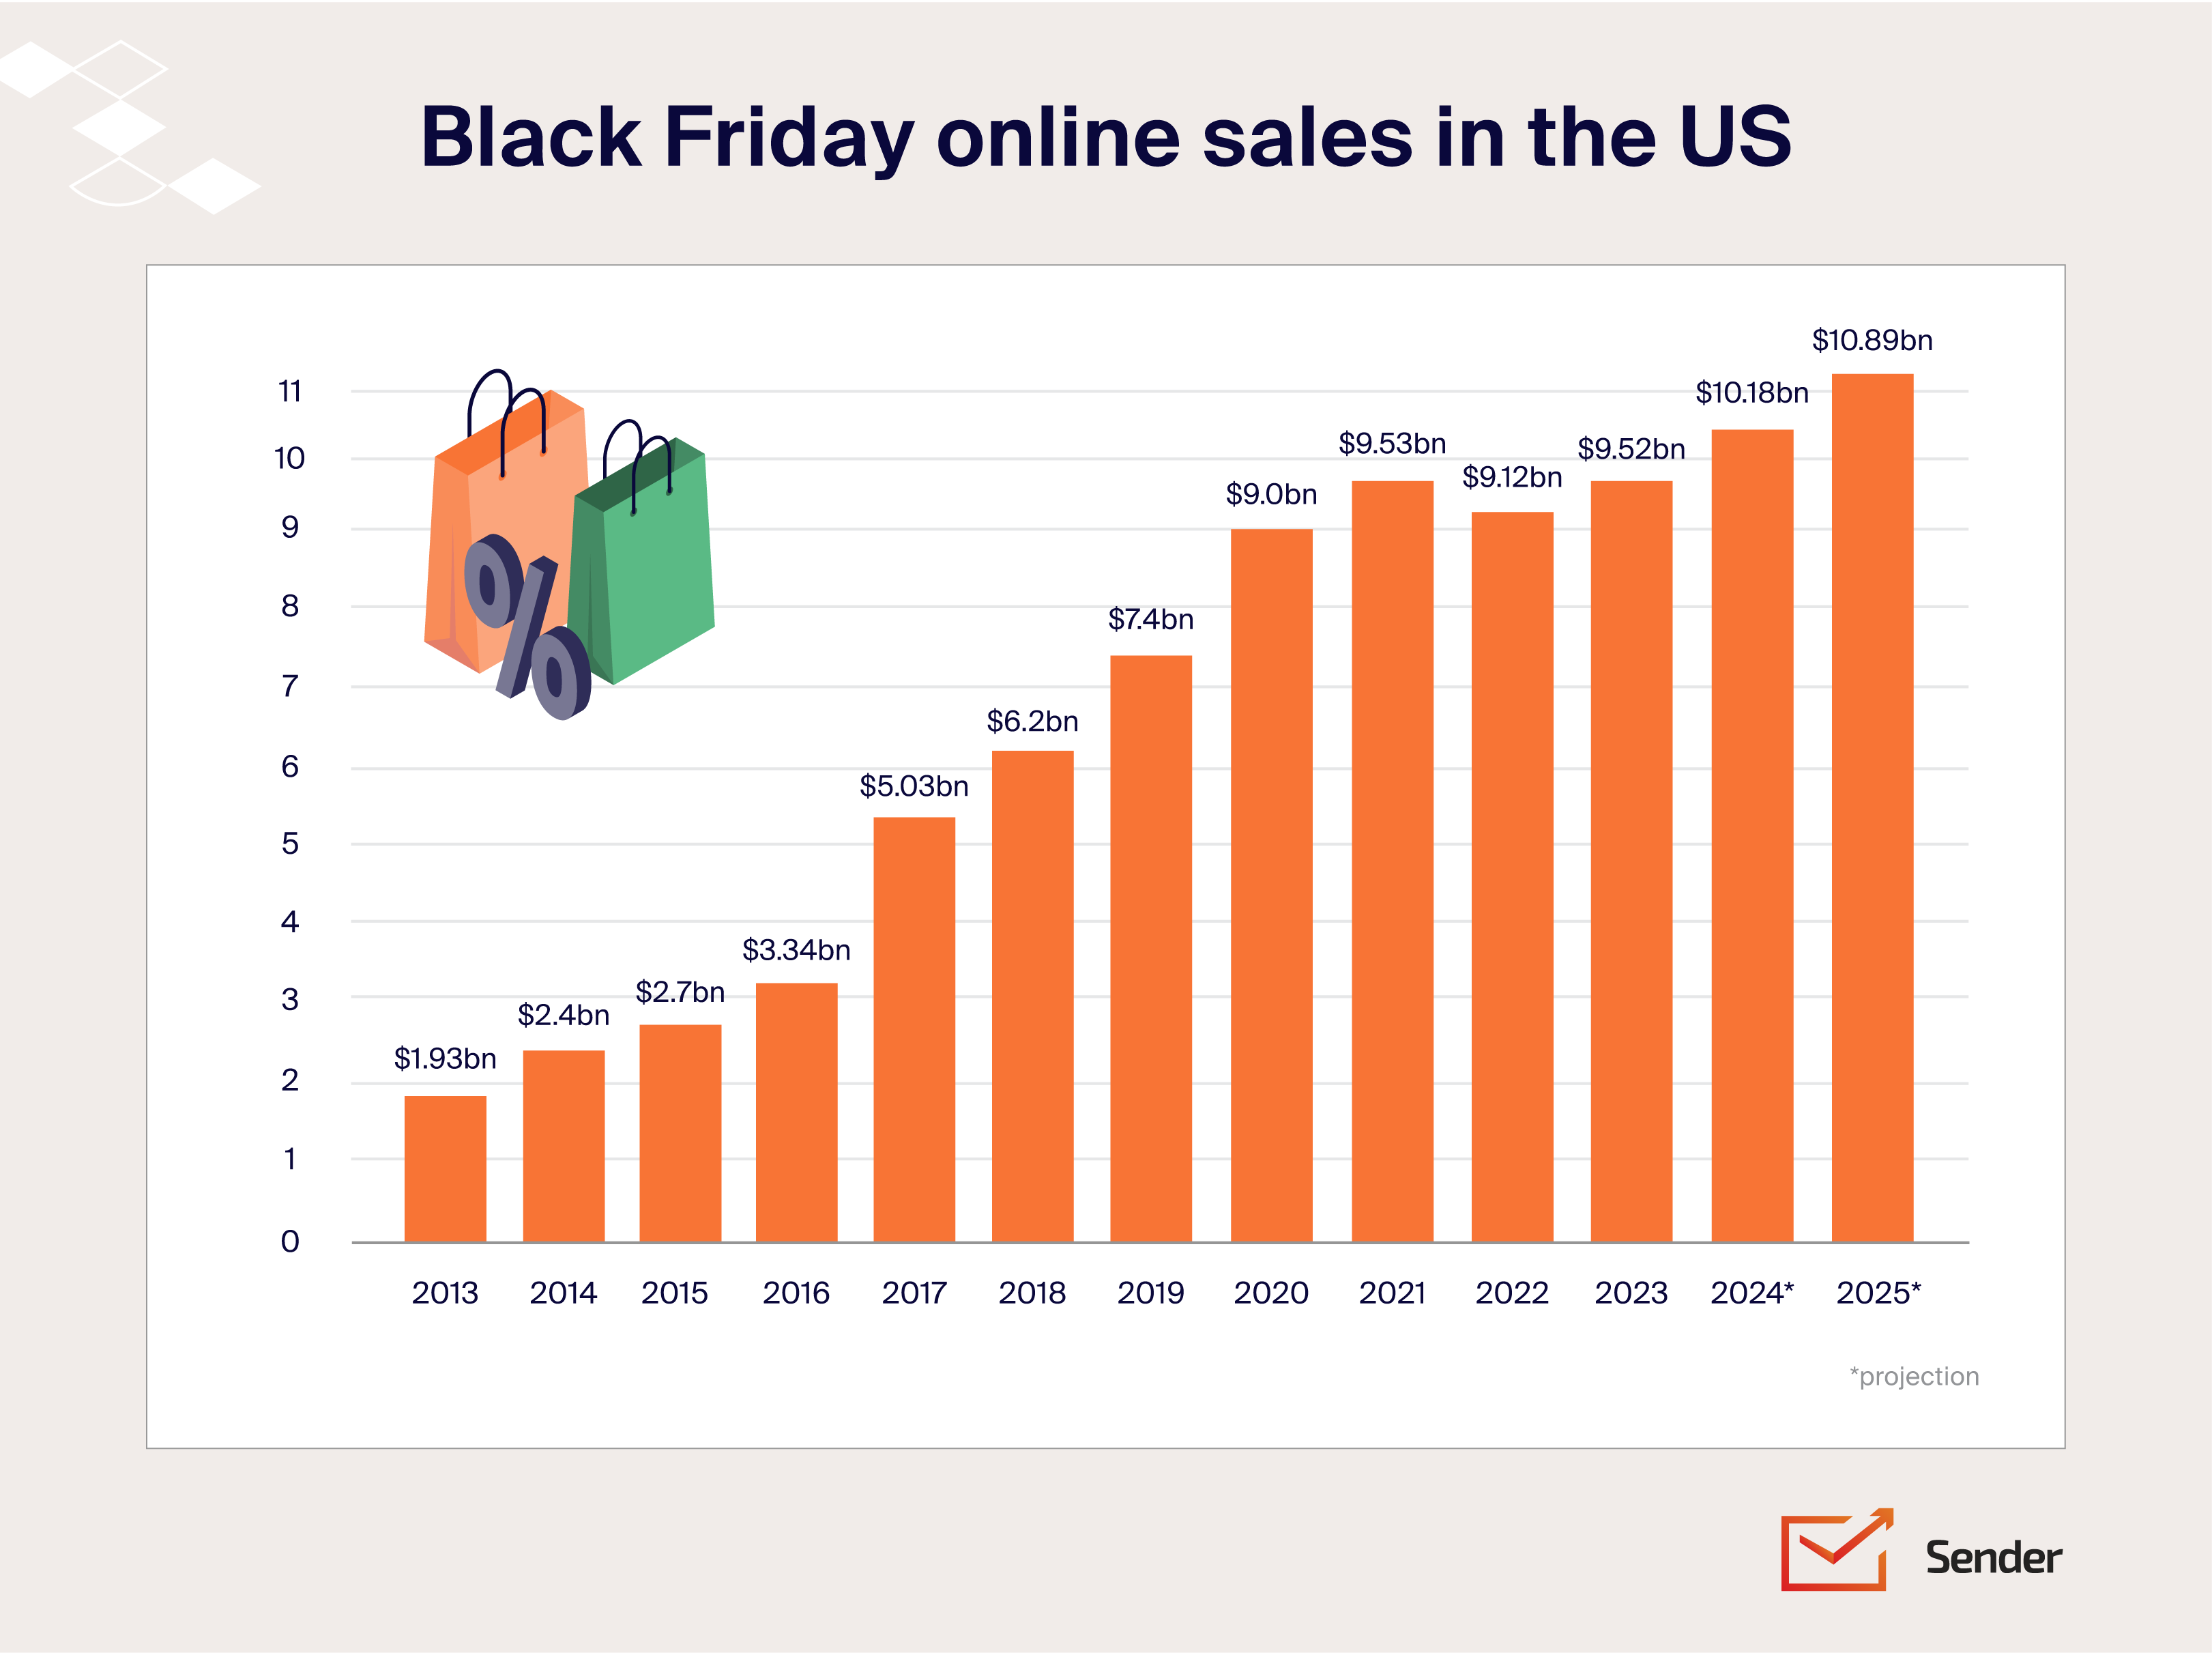
Black Friday Sales Growth Over the Years
According to recent market data, Black Friday sales have continued to grow, with US online Black Friday sales reaching $11.8 billion* in 2025, up from $10.8 billion in 2024, setting another ecommerce record.
Spending data also shows strong consumer demand during the broader holiday sales period. In 2025, the average Black Friday spending per shopper was about $622* across the entire weekend, reflecting the continued economic impact of major holiday sales events.
Global Black Friday Sales Statistics
Black Friday has become a global shopping event, generating tens of billions in online revenue and expanding rapidly beyond the United States. As retailers worldwide adopt the sales event, international participation and ecommerce spending continue to rise.
Global Black Friday 2025 statistics:
- $79 billion in global online Black Friday sales was recorded in 2025;
- Global Black Friday online revenue grew about 6% year over year compared with 2024;
- The United States remained the largest market, generating about $11.8 billion in online Black Friday sales;
- Other major Black Friday markets included the United Kingdom, Germany, Canada, and Japan;
- With $79 billion globally vs. $11.8 billion in the US, the American market accounted for roughly 15% of total global Black Friday online spending.
Conversion Rates on Black Friday
Shopify data reveals that the average conversion rate for online stores during Black Friday is 5.86%, significantly higher than the annual ecommerce average of 2.8%*, demonstrating the effectiveness of targeted promotions during major shopping events. What’s surprising is that Black Friday cart abandonment statistics barely change compared to a regular day, staying at around 70%*.
Although mobile shopping continues to grow rapidly, desktop still converts better, achieving conversion rates of around 6.8% compared to 3.5%* for mobile devices.
Black Friday Consumer Behaviour
Most recent Black Friday participation statistics indicate that about 74%* of Americans planned to shop during the Black Friday–Cyber Monday period in 2025, with electronics and clothing remaining among the most sought-after product categories.
Here’s a broader look at what American Black Friday shoppers planned to buy in 2025:
Christmas presents for friends and loved ones – 61%;
Clothing and accessories – 61%;
Electronics and tech products – 56%;
Toys and hobbies – 52%;
Household goods and home products – 41%;
Beauty and personal care products – 34%;
Groceries and everyday essentials – 31%;
“I don’t plan to shop during Black Friday” – 13%.
Interestingly, Black Friday continues to expand beyond the United States. Around 18%* of global ecommerce orders during the BFCM period are now cross-border purchases, highlighting how the event has evolved into a truly global shopping phenomenon.
There’s also a push from B2C into B2B, according to the latest B2B ecommerce trends.
Online and Ecommerce Sales Statistics
Black Friday remains one of the biggest global retail events, generating billions in sales each year and driving massive spikes in ecommerce activity. In 2025, online Black Friday sales reached a record $11.8 billion, while many retailers extended promotions across the entire week to capture shoppers earlier and reduce competition on the day itself.
Shopping behavior also continues to shift toward digital channels, particularly mobile devices. Ecommerce now dominates Black Friday purchases, and brands are increasingly relying on email campaigns, apps, and direct website traffic to capture shoppers looking for the best deals.
Here are the most noteworthy Black Friday checkout behavior statistics:
- Cyber Week 2025 generated $44.2 billion in online sales across Thanksgiving through Cyber Monday;
- 70% of online orders during Cyber Week 2025 came from mobile devices;
- 80% of digital traffic during Cyber Week 2025 originated from mobile devices;
- Over 40% of email campaigns promoted Black Friday discounts by the Monday before Thanksgiving.
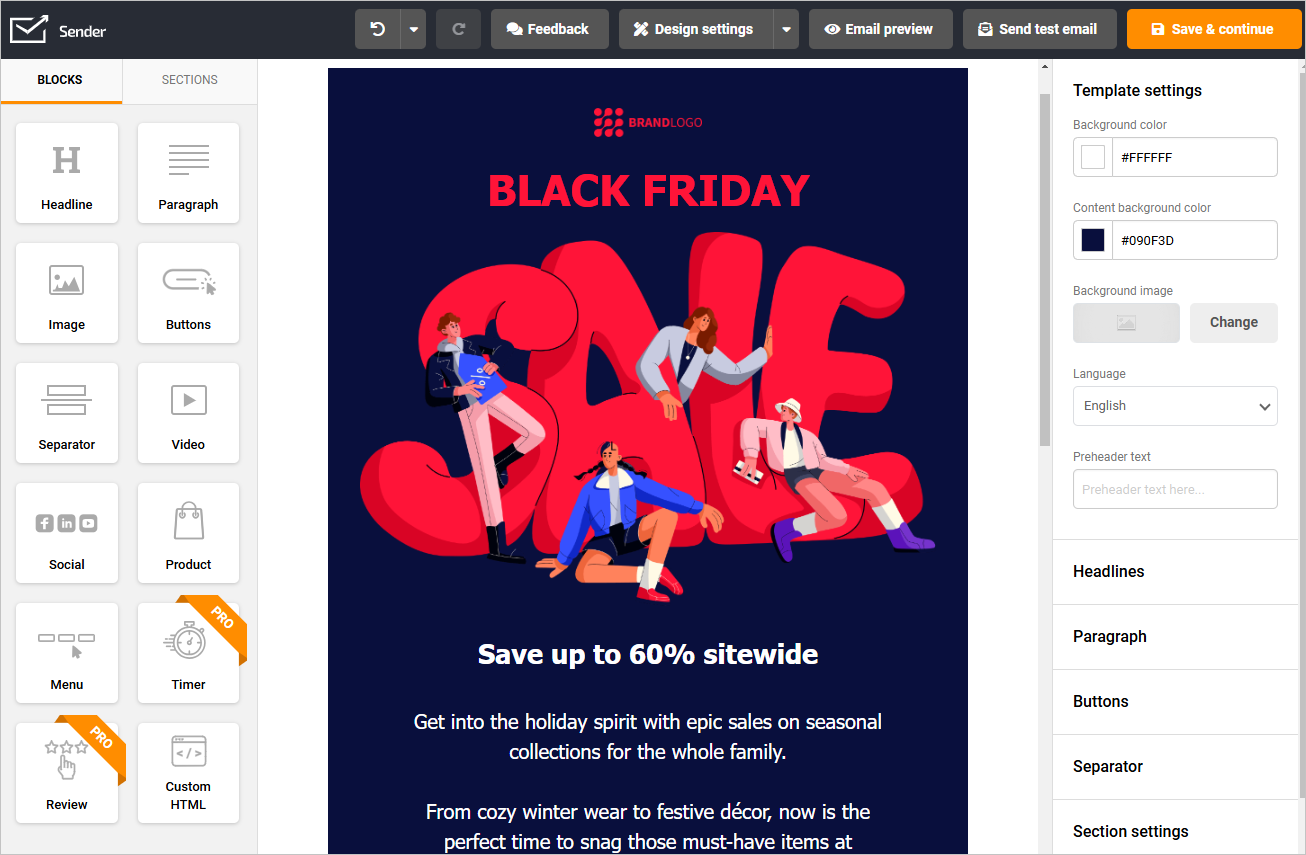
Email marketing is a whole lot easier with Sender. Sign up for a free account and create a stunning Black Friday email campaign in under an hour.
Learn more about email personalization: Guide to Personalized Email Marketing.
Shopify Black Friday Statistics
With $14.6 billion* in Black Friday–Cyber Monday revenue, representing a 27%* year-over-year increase, Shopify merchants set a new record during the 2025 BFCM weekend, demonstrating the continued strength of ecommerce.
This success translated into over 81 million* global consumers purchasing from Shopify-powered brands, with a peak sales rate of $5.1 million* per minute during the shopping event.
Amazon Black Friday Statistics
In 2025, Amazon announced 12 days of deals from November 20 through Cyber Monday. These Black Friday early shopping statistics show how retailers are extending promotions earlier each year. That said, ecommerce and mobile shopping driving more than 57%* of total sales.
Electronics, toys, and beauty products dominated shopping lists, while strong demand for fast shipping and easy returns fueled a sharp rise in repeat purchases.
Buy Now Pay Later (BNPL) Statistics
Buy Now Pay Later continues to grow as more consumers use installment payments for online purchases. The latest data shows rising adoption, higher spending, and strong expansion of the global BNPL market.
- The global BNPL market is expected to reach $560.1 billion in 2025, growing 13.7% year over year;
- About 91.5 million consumers in the United States are expected to use BNPL in 2025;
- The average BNPL transaction in the US is around $135;
- 56% of BNPL users say PayPal is their most commonly used provider;
- BNPL usage continues to increase as shoppers rely on installment payments for larger purchases.
Average Black Friday Discounts
Speaking of Black Friday deal popularity statistics, shoppers continued to see strong deals in 2025, with average discounts reaching about 24%* globally, slightly lower than the previous year as retailers balanced promotions with rising costs. While Amazon’s Black Friday average order value statistics showed a 32%* increase versus early November.
Top global average discount rates included:
- Makeup – 40%;
- General apparel – 27%;
- Skincare – 26%.
Black Friday Shopping Trends
Though not completely unforeseen, Black Friday shopping trends are gaining speed:
Mobile Shopping Trends on Black Friday
Mobile shopping continues to dominate the Black Friday and Cyber Week period. In 2025, mobile devices accounted for over 70%* of online orders and about 80%* of total digital traffic, highlighting the growing importance of mobile-optimized shopping experiences for capturing holiday revenue.
During the holiday season, SMS marketing also saw significant growth. Black Friday weekend typically brings a sharp increase in promotional messaging, with SMS message volume rising by about 30%* during the peak shopping weekend as brands use the channel to deliver time-sensitive deals and reminders.
In the week leading up to Black Friday, SMS campaigns also increase substantially as retailers prepare audiences for upcoming promotions.
Trends in Black Friday Advertising Spend
Black Friday 2025 saw another increase in advertising, with retail media ad spend rising 33%* and paid social ad spend increasing 9%* as brands competed for shoppers’ attention.
Cyber Monday Sales Influence on Black Friday
Cyber Monday has been surpassing Black Friday in recent years. In 2025, Cyber Monday hit a record $14.25 billion in sales in the US, compared to $11.8 billion on Black Friday, while the entire Cyber Week totaled a staggering $44.2 billion*. This trend continues to grow, with many consumers now preferring Cyber Monday deals online.
In general, online sales remain the king of BFCM sales, surpassing other shopping destinations*:
- Online – 44%;
- Grocery stores and supermarkets – 42%;
- Department stores – 40%;
- Clothing and accessories stores – 36%;
- Electronics stores – 29%.
Historical Spending Trends
Analyzing historical sales and spending trends reveals significant increases in Black Friday sales. For instance, the online sale of toys increased by 622%* on Black Friday compared to a normal day, with sales (including games) growing by roughly 28%* year-over-year.
Here’s what Americans said they planned to buy during Black Friday in 2025:
- Clothing – 61%;
- Tech products – 56%;
- Gifts – 56%;
- Toys and hobbies – 52%;
- Clothing and accessories – 76%.
Effectiveness of Email Marketing for Black Friday
Email marketing remains a powerful tool for Black Friday promotions. Campaigns targeting past purchases can significantly boost conversion rates and overall sales, while personalized emails with tailored discounts tend to drive higher engagement during peak shopping periods.
Is email marketing effective during the holiday season? Holiday promotional emails typically see open rates about 31%* higher than regular campaigns, while click-through rates increase by around 25%* during major sales events like Black Friday and Cyber Week.
Social media platforms also play an important role in Black Friday shopping. About 48%* of online shoppers discover deals through social media platforms, including influencer promotions and paid advertisements.
However, social media’s direct impact on revenue remains relatively limited. Only around 6–7%* total Black Friday and Cyber Monday ecommerce sales are directly attributed to social media traffic, suggesting that many shoppers discover deals on social platforms but complete purchases elsewhere.
Social Media Influence on Black Friday Shopping
Social media platforms play a crucial role in Black Friday shopping. Approximately 42% of online shoppers discover deals through social media ads and influencers.*
However, social media’s influence on Black Friday is debatable as it drives only an average of 5%* of total sales on Black Friday and Cyber Monday.
Impact of Black Friday on Small Businesses
According to holiday shopping statistics, small businesses also benefit from Black Friday (including Small Business Saturday), with many reporting a 20% increase in sales during the Black Friday weekend.*
Top-Selling Products on Black Friday
Recent data shows that electronics, apparel, and furniture accounted for 53.7%* of online holiday spending in 2025, highlighting their importance during the Black Friday shopping period.
In 2025, discounts peaked at 30.9% for electronics, 29.6% for toys, and 25.1%* for apparel, reinforcing their position among the top Black Friday product categories.
But wait, there’s more! Check out these great articles to improve your holiday marketing game:
- Black Friday Marketing: 16 Strategies to Skyrocket Sales
- 22 Black Friday Email Examples to Help You Stand Out
- 65+ Online Advertising Statistics (Facts and Figures for 2025)
*Sources:
- https://www.demandsage.com/black-friday-statistics/
- https://www.statista.com/topics/8714/black-friday-worldwide/
- https://www.activecampaign.com/blog/black-friday-statistics
- https://www.finder.com/credit-cards/black-friday-statistics
- https://dotdigital.com/blog/black-friday-cyber-monday-stats/
- https://www.statista.com/statistics/247204/online-shopping-cart-conversion-and-abandonment-rate-on-black-friday/
- https://www.tidio.com/blog/black-friday-trends/
- https://wisernotify.com/blog/black-friday-stats/#online-vs.-in-store-sales-over-time
- https://growthdevil.com/amazon-black-friday-statistics
- https://www.mobiloud.com/blog/black-friday-statistics
- https://business.adobe.com/resources/holiday-shopping-report.html
- https://statistics.blackfriday
- https://retailnext.net/press-release/early-data-u-s-black-friday-in-store-traffic-down-3-2-yoy
- https://www.pymnts.com/study_posts/sales-not-sentiment-drives-black-friday-turnout
- https://www.dhl.com/global-en/microsites/ec/ecommerce-insights/insights/reports/2025-black-friday-trends.html
- https://www.digitalcommerce360.com/article/black-friday-ecommerce-sales/
- https://nrf.com/media-center/press-releases/197-million-consumers-shop-over-thanksgiving-holiday-weekend
- https://www.deloitte.com/us/en/about/press-room/deloitte-black-friday-cyber-monday-spending-expected-to-reach-new-highs.html
- https://news.adobe.com/news/2025/12/adobe-cyber-monday-hits-record
- https://www.salesforce.com/news/stories/2025-cyber-week-predictions
- https://www.klaviyo.com/uk/bfcm/email-marketing-strategy
- https://www.mastercard.com/us/en/news-and-trends/press/2025/november/mastercard-spendingpulse–us-black-friday-retail-sales-up–4-1–.html
- https://statistics.blackfriday/
- https://www.forbes.com/sites/joanverdon/2025/11/29/black-friday-data-shows-online-sales-strong-store-results-mixed/
- https://hawkemedia.com/insights/hawke-ai-bfcm-2025/
- https://capitaloneshopping.com/research/buy-now-pay-later-statistics
- https://www.fintechfutures.com/press-releases/buy-now-pay-later-global-business-report-2025-bnpl-payments-to-grow-by-13-7-to-surpass-560-billion-this-year-driven-by-klarna-afterpay-paypal-and-affirm-forecast-to-2030
- https://impact.com/partnerships/black-friday-consumer-insights
- https://www.novadata.io/resources/news/black-friday-cyber-monday-2025-record-results
- https://skai.io/press-releases/quarterly-trends-report-q4-2025
- https://www.shopify.com/investors/press-releases/shopify-merchants-achieve-record-breaking-14-6-billion-in-black-friday-cyber-monday-sales
- https://queue-it.com/blog/black-friday-statistics
- https://www.deloitte.com/us/en/about/press-room/deloitte-survey-black-friday-cyber-monday.html
- https://fortune.com/2025/11/30/how-much-did-americans-spend-black-friday-consumer-spending/
- https://ecommercegermany.com/blog/black-friday-ecommerce-performance-analysis/
- https://www.realitymine.com/articles/black-friday-2025-shopper-behavior